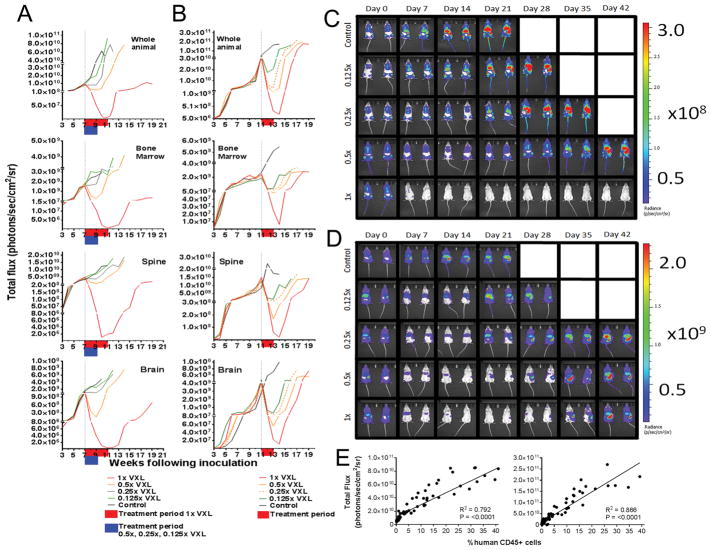
Figure 2. In vivo efficacy of titrated VXL doses against ALL-11-GL and ALL-57-GL measured by bioluminescence imaging (BLI).
The responses of ALL-11-GL (A, C) and ALL-57-GL (B, D) to the combination treatment VXL at a range of doses; 1x, 0.5x, 0.25x and 0.125x the doses of vincristine (0.15 mg/kg), dexamethasone (5 mg/kg) and L-asparaginase (1000 U/kg). Treatment began once a median of 1% huCD45+ cells in PB was reached for each cohort. Weekly imaging data representing whole animal and organ-specific bioluminescence are presented graphically as the median bioluminescence intensity for each treatment group (p/s/cm2/sr) (A, B), with treatment periods shown in red and blue on the individual graphs and Day 0 represented by a vertical dotted line. Cohorts are labeled on the legend for each graph set, with the cohorts colored to match the objective response measure (ORM score according to PPTP criteria). Images of representative mice for each cohort are shown at weekly intervals throughout the evaluation period of 42 days, acquired using the Spectrum CT in vivo imaging system (C, D). Images were analyzed using the LivingImage v4.4 software. (E) Where available (>0.1% huCD45+ cells), PB data were plotted against matched whole animal BLI values for ALL-11-GL (left panel) and ALL-57-GL (right panel) and subjected to Pearson correlation. R, Pearson correlation coefficient; P-value, two-tailed P-value of the Pearson correlation.

