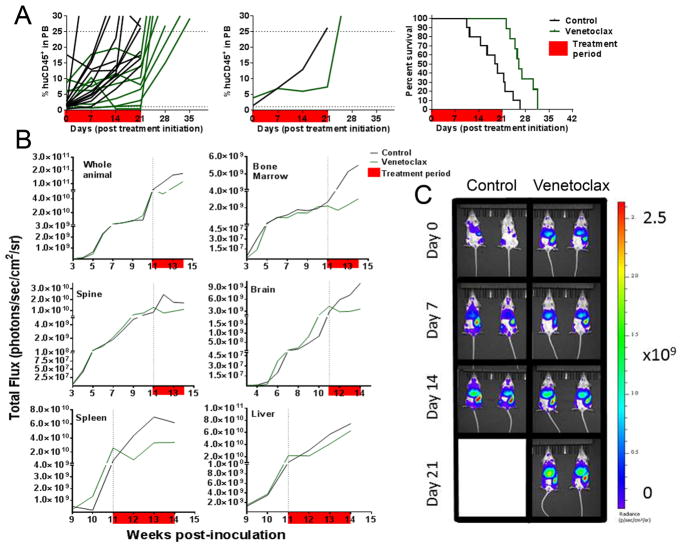
Figure 5. In vivo efficacy of venetoclax against ALL-57-GL.
The response of ALL-57-GL to venetoclax (100 mg/kg) as measured by %huCD45+ cells in mouse PB (A), showing individual mouse PB values (left), median group PB values (center) and Kaplan-Meier survival plot (right). (B) Efficacy of venetoclax against ALL-57-GL as measured by BLI for the whole animal and individual organs (as labeled). Response to each treatment is visualized as the median bioluminescence intensity (p/s/cm2/sr) for each cohort. The treatment period is shown in red. (C) Images of representative mice from both venetoclax-treated and control cohorts are shown at weekly intervals throughout the evaluation period of 21 days (to event). All imaging data were acquired using the Spectrum CT in vivo imaging system. Images were analyzed with the LivingImage v4.4 software.

