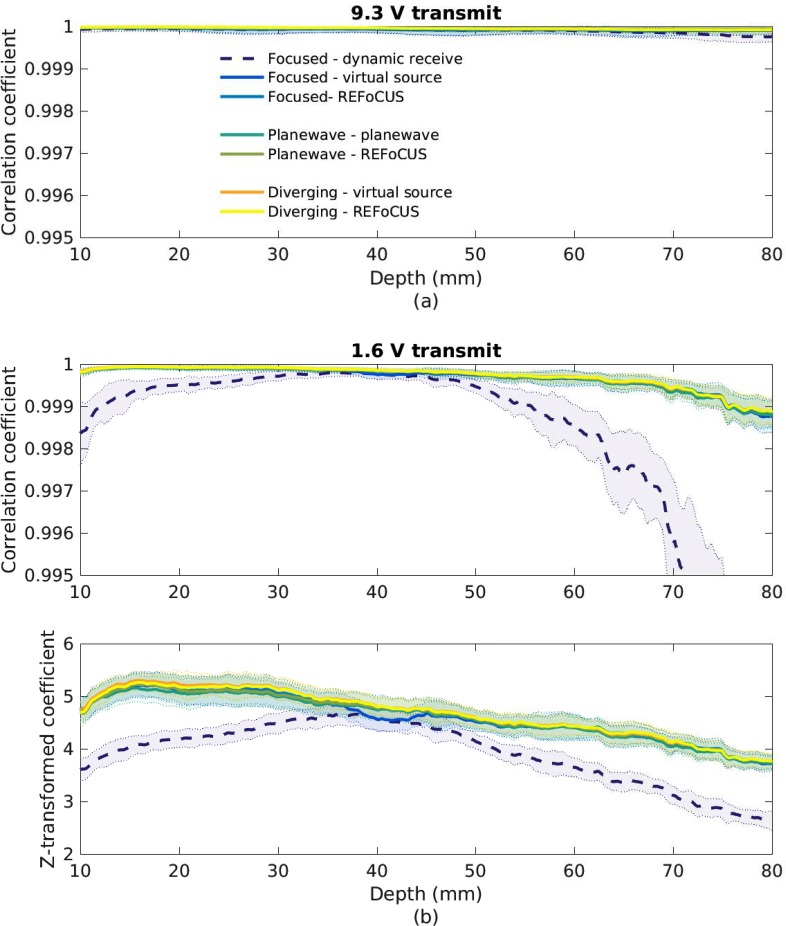
FIG. 11.
(Color online) Temporal correlation in a speckle phantom for varying transmit and beamforming configurations with (a) 9.3 V and (b) 1.6 V transmit voltages. The shaded error bars indicate the standard deviation over ten temporal frames at each of ten spatial locations. For (b), the Fisher z-transform has been applied to display the correlation values as a normal distribution, increasing the dynamic range of the displayed data.

