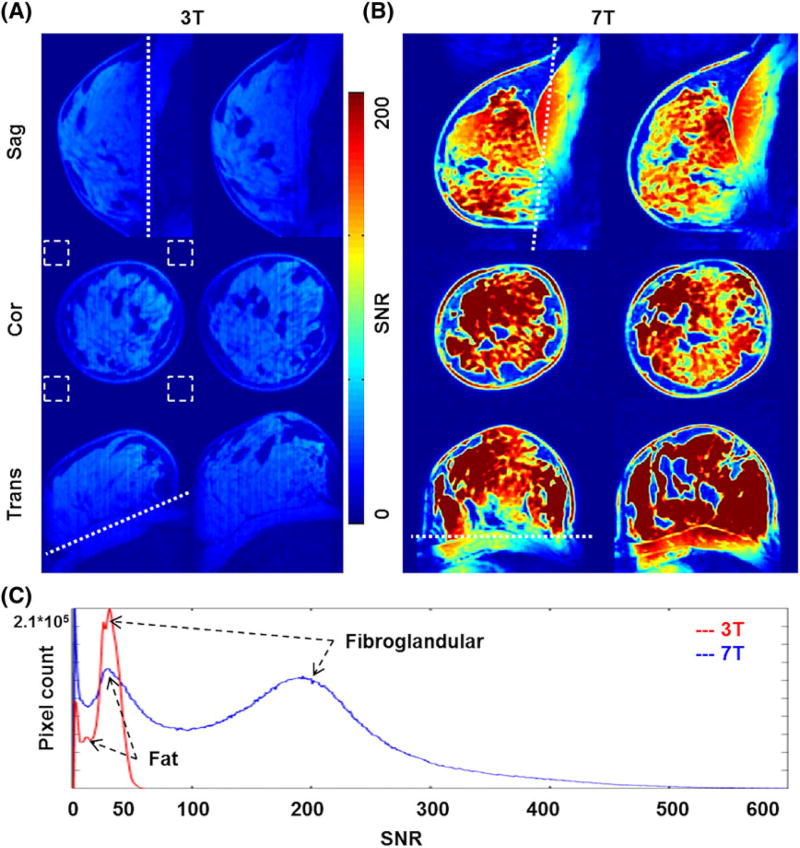
FIGURE 5.
A,B, SNR comparison in 3 T versus 7 T in vivo breast MRI. A, About 50 SNR was measured in the FG tissue regions. B, A mean SNR increase of about fourfold was measured, with clear delineation of FG tissues from fat. C, Quantitative SNR distribution at 3 T and 7 T. Two peaks indicate FG and fat tissues, and an SNR contrast of about 4 was measured at 7 T whereas about 2 was measured at 3 T. Note that the background noise was calculated in the four corners of the coronal images (white dotted boxes) due to the respiratory motion artifact in the sagittal planes

