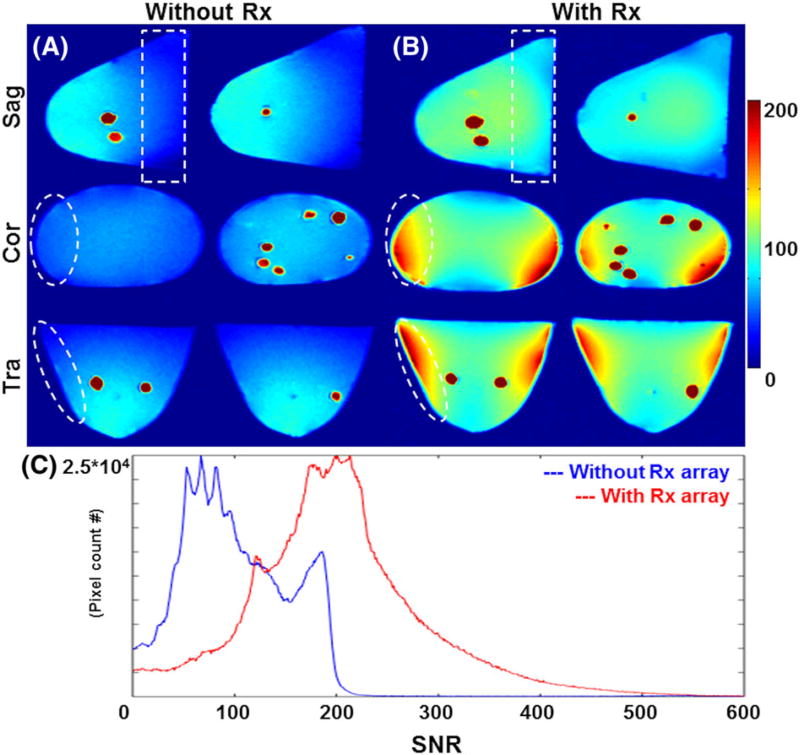
FIGURE 6.
SNR evaluation with and without Rx-only array at 7 T using breast phantom. A, SNR map of breast phantom without Rx-only array. Noise voltage was high due to the increased volume of reception and SNR was about 80 (Tx-only array was used as Tx/Rx). B, The Tx-only array combined with the Rx-only array shows significant increase of SNR at the phantom periphery and toward the coil end, successfully reducing the noise voltage (white dotted circle and box). C, SNR distribution measured in the breast phantom. Without the Rx-only array, a mean SNR of about 80 was measured; however, when the Tx-only array was combined with the Rx-only array set-up, the SNR of the phantom increased to about 200. The breast phantom does not have different tissues, thus differentiating fat and FG was not feasible

