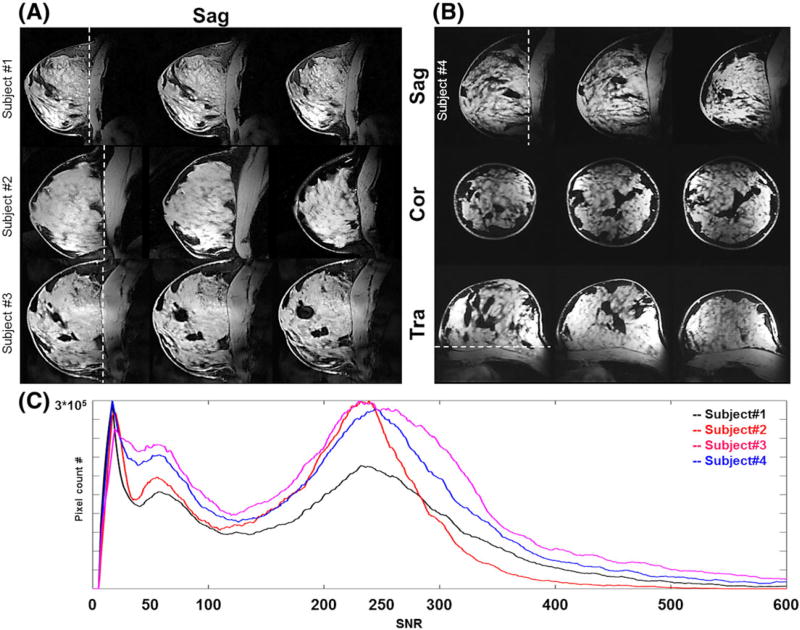
FIGURE 8.
In vivo 7 T 0.6 mm3 isotropic T1-weighted with fat-suppression MR images. A, Sagittal view of breast MRI for three different subjects showing high SNR/contrast between the FG and fat tissues. B, Breast MR images of one subject showing three different planes: sagittal, coronal, and transverse. C, SNR distribution from four subjects showing good inter-subject reproducibility with about fourfold SNR difference between FG tissues and fat tissues.

