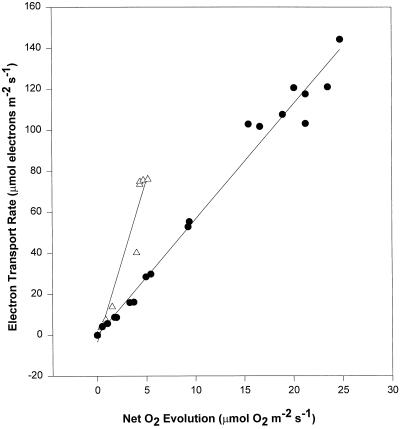
Figure 4.
The relationship between ETR and net O2 evolution (corrected for respiration rates) from curves 1 and 6 (●) and curve 3 (▵) of Figure 1. The slopes of these relationships are 5.6 for controls and 15.7 for stressed leaves. The relationships for the other curves lie between these two curves (not shown).

