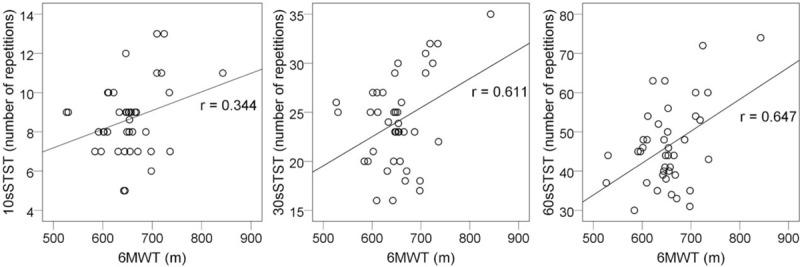
Figure 1.

Scatter plot for the correlations of the number of repetitions in each sit-to-stand test with the maximum distance walked in 6-minute walk test. P < .05 for each plot. 6MWT = 6-minute walk test, 10sSTST = 10 seconds sit-to-stand test, 30sSTST = 30 seconds sit-to-stand test, 60sSTST = 60 seconds sit-to-stand test.
