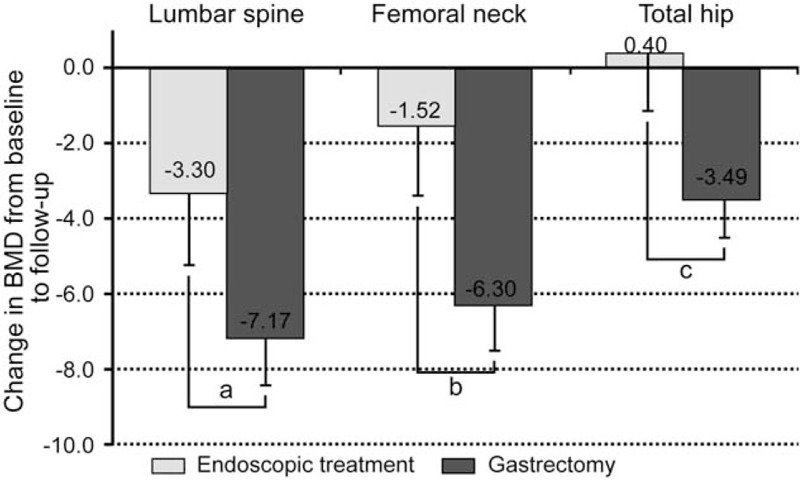
Figure 1.

Percentage changes in BMD from baseline to follow-up in the endoscopic treatment group (n = 15) and gastrectomy group (n = 34). BMD values are calculated as mean ± SE and are adjusted for age and follow-up period. aP = .028, bP = .022, and cP = .137 between the 2 groups. BMD = bone mineral density, SE = standard error.
