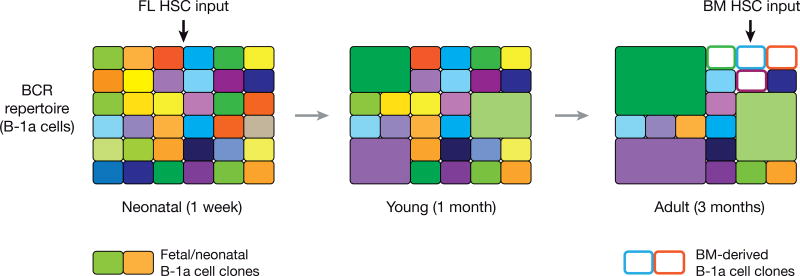
Figure 3. Clonal evolution of the BCR repertoire of B-1a cells throughout adult life.
The schematic diagrams of the B-1a BCR repertoire in neonatal, young and adult mice are based on data obtained by high-throughput CDR3 sequencing of rearranged Igh transcripts [9]. Each rectangle represents a unique CDR3 sequence, and the size denotes the relative frequency (clone size) of an individual sequence. B-1a cell clones derived from FL HSCs are shown as filled colored rectangles, while B-1a cell clones originating from BM HSC are indicated by white rectangles.

