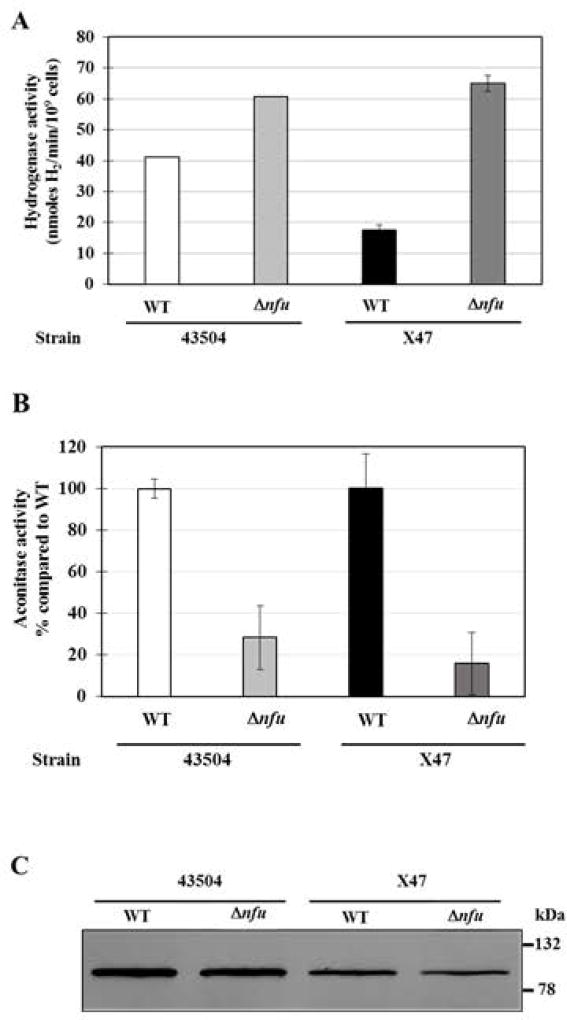
Fig. 4. Hydrogenase activity, aconitase activity and aconitase levels in WT and Δnfu mutant strains.
(A) Hydrogenase activities. Whole cell hydrogenase assays were used to measure the H2-uptake activity of two independent Δnfu mutants and their parental strains. Results represent mean and standard deviation from 3 to 4 independent measurements and are expressed as nmoles of H2 used per min per 109 H. pylori cells. (B) Aconitase activities. Assays were carried out using cell-free extracts (CFE) from Δnfu and WT cells. Results shown represent means and standard deviations from three independent growth experiments, with assays done in triplicate. Activities are expressed as percentages compared to the parental strain.
(C) Aconitase immunoblot. Identical amounts of cell-free extracts (5 µg total protein) were loaded in each lane. Proteins were separated on a SDS-10% polyacrylamide gel, along with prestained mass standards (size are indicated on the right) and the proteins were then transferred onto a nitrocellulose membrane and subjected to immunoblotting using anti-E. coli AcnB antiserum. Densitometry analysis based on three independent immunoblots (including this one) revealed the following integrated density (pixels): 228,000 ± 17,000 for strain 43504, 186,000 ± 22,000 for 43504 Δnfu, 188,000 ± 56,000 for X47 and 160,000 ± 75,000 for X47 Δnfu.

