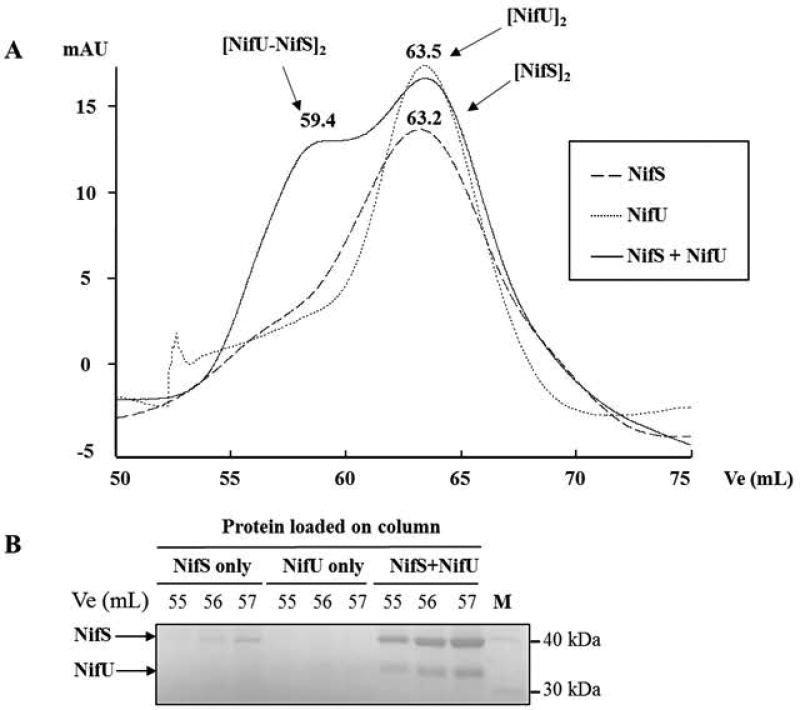
Fig. 8. Size exclusion chromatography analysis of NifS-NifU protein complexes.
Purified NifS and NifU were run separately, then together, on a HiLoad 16/60 Superdex 75, and 1 mL fractions were collected and analyzed by SDS-PAGE. Elution volumes (Ve) were recorded for each protein complex, Ve/Vo ratio were calculated and a standard curve with molecular weight markers was used to determine molecular weights for each complex. (A) Chromatograms showing NifS only, NifU only and NifS and NifU together. Ve (mL) and the proposed protein oligomeric state are shown above each peak. (B) Fractions corresponding to the same Ve (55, 56, 57 mL) for each experiment were analyzed on SDS-PAGE. NifS (42.4 kDa) and NifU (36.3 kDa) are indicated by an arrow.

