

Abstract
In Escherichia coli, one Sigma factor recognizes the majority of promoters, and six “alternative” Sigma factors recognize specific subsets of promoters. The alternative Sigma factor FliA (σ28) recognizes promoters upstream of many flagellar genes. We previously showed that most E. coli FliA binding sites are located inside genes. However, it was unclear whether these intragenic binding sites represent active promoters. Here, we construct and assay transcriptional promoter-lacZ fusions for all 52 putative FliA promoters previously identified by ChIP-seq. These experiments, coupled with integrative analysis of published genome-scale transcriptional datasets, strongly suggest that most intragenic FliA binding sites are active promoters that transcribe highly unstable RNAs. Additionally, we show that widespread intragenic FliA-dependent transcription may be a conserved phenomenon, but that specific promoters are not themselves conserved. We conclude that intragenic FliA-dependent promoters and the resulting RNAs are unlikely to have important regulatory functions. Nonetheless, one intragenic FliA promoter is broadly conserved, and constrains evolution of the overlapping protein-coding gene. Thus, our data indicate that intragenic regulatory elements can influence bacterial protein evolution, and suggest that the impact of intragenic regulatory sequences on genome evolution should be considered more broadly.
ABBREVIATED SUMMARY
Recent findings have identified thousands of bacterial promoters in unexpected locations, such as inside genes. Here, we investigate the functions of intragenic promoters for the flagellar sigma factor FliA. Our data suggest that most of these promoters are not functional, but that one intragenic FliA promoter is broadly conserved, and constrains evolution of the overlapping protein-coding gene. Our data suggest that intragenic regulatory sequences significantly impact bacterial genome evolution.
INTRODUCTION
In bacteria, RNA polymerase (RNAP) requires a transcription initiation factor, σ, to recognize promoter elements and initiate transcription. Bacteria encode one housekeeping σ factor that functions at most promoters, and multiple “alternative” σ factors that each recognize smaller sets of promoters. Historically, promoters were thought to be located solely upstream of annotated genes. However, widespread transcription initiation from inside genes has now been described in Escherichia coli and many other species (reviewed, (Lybecker et al., 2014; Wade and Grainger, 2014)). Consistent with these observations, the E. coli housekeeping σ factor, σ70, has been shown to bind many intragenic sites (Singh et al., 2014). Similar findings have been reported for alternative σ factors, e.g. 40% of Mycobacterium tuberculosis SigF binding sites, 25% of E. coli σ32 binding sites, and 62% of E. coli σ54 binding sites are inside genes (Wade et al., 2006; Hartkoorn et al., 2012; Bonocora et al., 2013; Bonocora et al., 2015). The high degree of pervasive transcription involving multiple σ factors suggests that intragenic promoters have a substantial impact on global transcriptional networks.
Like σ factors, DNA-binding transcription factors often bind extensively within genes (Shimada et al., 2008; J. Galagan et al., 2013; J. E. Galagan et al., 2013; Bonocora et al., 2013; Wade and Grainger, 2014; Grainger, 2016). The regulons of most transcription factors have not been mapped, even for E. coli, suggesting that most intragenic binding sites remain to be identified. Indeed, a study of 51 transcription factors in Mycobacterium tuberculosis suggests that a typical bacterial genome contains >10,000 intragenic binding sites (J. E. Galagan et al., 2013). The transcriptional activities of most intragenic transcription/σ factor binding sites have not been extensively studied, but many are likely to be functional (J. E. Galagan et al., 2013). Although transcription regulatory networks evolve rapidly, individual regulatory interactions are often maintained by purifying selection (Lozada-Chávez et al., 2006; Perez and Groisman, 2009; Stringer et al., 2014). Hence, many intragenic transcription/σ factor binding sites may be functional, and thus are likely to be conserved. A previous study suggested that purifying selection on intragenic transcription/σ factor binding sites in human cells constrains the evolution of overlapping protein-coding genes (Stergachis et al., 2013). The impact of bacterial intragenic binding sites on overlapping protein-coding genes has not been assessed.
FliA (σ28) is an alternative σ factor involved in transcription of genes associated with flagellar motility and chemotaxis (reviewed (Paget, 2015)). FliA also initiates transcription of some non-flagellar genes in E. coli (Fitzgerald et al., 2014), and is encoded by some non-motile bacteria, such as Chlamydia (Yu and Tan, 2003), suggesting additional non-flagellar roles. Recently, we reported that over half of E. coli FliA binding sites are located inside genes, often far from gene starts (Fitzgerald et al., 2014). These intragenic sites were split approximately evenly between those occurring in the sense and antisense orientations, with respect to the overlapping gene. Most intragenic FliA binding sites were not associated with detectable FliA-dependent RNAs, so it is unclear whether they represent functional promoters. Notably, FliA is the most highly and broadly conserved alternative σ factor (Feklístov et al., 2014; Paget, 2015). The interactions between FliA, RNA polymerase, and promoter DNA are so highly conserved that the Bacillus subtilis homolog, σD, can complement an E. coli ΔfliA strain (Chen and Helmann, 1992). Like many alternative σ factors, FliA has a decreased ability to melt DNA as compared to housekeeping σ factors (Koo, Rhodius, Nonaka, et al., 2009; Feklístov et al., 2014). Thus, FliA-dependent transcription initiation requires a stringent match to its consensus promoter sequence (Koo, Rhodius, Campbell, et al., 2009). Together, the high conservation and readily identifiable motif make FliA a good model for evolutionary analysis of intragenic σ factor binding.
In this study, we evaluate the promoter activity of intragenic FliA binding sites in E. coli. We also assess the conservation of intragenic FliA promoters and map the Salmonella FliA regulon. We conclude that most intragenic FliA binding sites represent bona fide promoters that transcribe unstable intragenic RNAs. We show that extensive intragenic transcription by FliA is likely to be a conserved phenomenon, but the genetic locations of intragenic FliA promoters are generally not conserved. Nonetheless, we show that a single intragenic FliA promoter is under strong selective pressure that constrains the evolution of the FlhC protein. This is the first documented example of intragenic regulatory sequence impacting evolution of the overlapping protein-coding gene in a bacterium, and suggests that selective pressure on intragenic binding sites for σ factors and transcription factors is an overlooked factor in protein evolution in compact bacterial genomes.
RESULTS
Most intragenic FliA binding sites represent transcriptionally active promoters
To test whether FliA binding sites previously identified by ChIP-seq (Fitzgerald et al., 2014) represent active promoters, we generated transcriptional fusions of potential promoters to the lacZ reporter gene. For each of the 52 putative FliA promoters, the region from approximately −200 to +10 was cloned upstream of lacZ on a single-copy plasmid (Figure 1A). We chose to include 200 bp upstream sequence because at least one FliA promoter is regulated by a transcription factor binding upstream (Hollands et al., 2010). Plasmids were transformed into a motile strain of E. coli MG1655 (i.e. expressing FliA), or an isogenic ΔfliA derivative, and assayed for β-galactosidase activity. Of the 20 intergenic promoters, 15 displayed significant FliA-dependent activity (t-test, p ≤0.05; Figure 1B). Of the 30 intragenic promoters, 10 out of 16 sense- and 7 out of 14 antisense-orientation putative intragenic promoters showed significant FliA-dependent activity (t-test, p ≤0.05; Figure 1C). These intragenic FliA-dependent promoters include all five that have been previously associated with transcription of stable RNAs ((flhC)motAB-cheAW, (yafY)ykfB, (yjdA)yjcZ, (uhpT), and antisense (hypD), where genes in parentheses indicate those with an internal FliA promoter. One of the two putative promoters located in convergent intergenic regions also showed significant FliA-dependent activity (t-test, p ≤0.05; Figure 1C). It should be noted that some fusions had very high levels of background activity, which may have prevented the detection of lower levels of FliA-dependent transcription from these promoter fusions. Of note, no FliA-dependent activity was detected for the well-characterized promoters upstream of fliA, fliD, and fliL, likely due to overwhelming transcriptional activity from the strong, σ70-dependent, FlhDC-activated promoters known to be immediately upstream (Liu and Matsumura, 1996; Stafford et al., 2005; Fitzgerald et al., 2014). High β-galactosidase activity associated with the lacZ fusions for pntA, cvrA, glyA, proK, and insB-4/cspH suggest they are also likely to include σ70 promoters that may preclude identification of FliA-dependent transcription. Consistent with this, we previously detected σ70 binding sites <200 bp upstream of all of these putative FliA promoters (Singh et al., 2014).
Figure 1. Identification of transcriptionally active FliA binding sites using reporter gene fusions.

(A) Schematic of transcriptional fusions of potential FliA promoters to the lacZ reporter gene. For all FliA binding sites identified in a previous study, transcriptional fusions to lacZ were constructed using positions −200 to +10 relative to the predicted TSS based on the previously identified FliA binding motif (Fitzgerald et al., 2014). (B) β-galactosidase activity for transcriptional fusions for FliA binding sites in intergenic regions upstream of genes, for wild-type (wt; DMF122; green bars) and ΔfliA (DMF123; gray bars) cells. Reporter fusions that showed significantly lower β-galactosidase activity in ΔfliA cells than wild-type cells (t-test p < 0.05) are indicated. The genes downstream of the FliA binding sites are listed on the x-axis. (C) As above, but for FliA binding sites within genes or between convergently transcribed genes. Genes containing FliA binding sites are listed on the x-axis in parentheses. Genes not in parentheses are downstream of the corresponding FliA binding site. Error bars indicate one standard deviation from the mean (n = 3).
We previously identified FliA-regulated transcripts using RNA-seq, although most intragenic FliA sites were not associated with a detectable RNA (Fitzgerald et al., 2014). However, this method often fails to detect unstable RNAs. To independently assess whether intragenic FliA binding sites act as promoters, we analyzed two published datasets generated from motile E. coli strains: (i) genome-wide transcription start site (TSS) mapping by differential RNA-seq (dRNA-seq) (Thomason et al., 2015), and (ii) Nascent Elongating Transcript sequencing (NET-seq) (Larson et al., 2014). dRNA-seq identifies TSSs by selectively degrading processed transcripts bearing a 5′ monophosphate, and then preparing a library from the remaining 5′ triphosphate-bearing primary transcripts (Sharma and Vogel, 2014). By focusing reads to the 5′ ends of transcripts, this technique is more sensitive than standard RNA-seq, and can distinguish intragenic RNAs from overlapping mRNAs. NET-seq isolates nascent RNA still bound to RNAP, facilitating detection of unstable transcripts prior to degradation (Churchman and Weissman, 2011).
To compare FliA binding site location to TSS mapping data, we determined the distance from the predicted FliA promoter sequence associated with each FliA binding site (Fitzgerald et al., 2014) to all downstream TSSs within 500 bp (Figure 2A). For most well-characterized FliA-dependent promoters for flagellar genes, the distance between the center of the promoter sequence and TSS was between 18 and 22 bp. For other FliA binding sites, we observed a strong enrichment for TSSs between 18 and 23 bp downstream of FliA motif centers. In total, 38 of the 52 FliA binding sites have a TSS located 18–23 bp downstream of the center of their predicted promoter. This positional enrichment is highly significant when compared to the same analysis performed with a randomized TSS dataset; only one random TSS was between 18–23 bp downstream of a FliA motif center (Fisher’s exact test, p<0.0001).
Figure 2. Identification of transcriptionally active FliA binding sites by mining genome-scale transcriptome datasets.

(A) For each FliA binding site identified previously (Fitzgerald et al., 2014), we determined the distance to each downstream TSS identified previously (Thomason et al., 2015) within a 500 bp range. The frequencies of these distances are plotted in 10 bp bins (green line), with the inset showing the frequency of binding sites 10–30 bp upstream of TSSs with a bin size of 1 bp. The gray line shows the frequency of distances from FliA binding sites to a control, randomized TSS dataset (see Methods). (B) Normalized sequence read coverage from published NET-seq data (Larson et al., 2014) (see Methods) for each previously identified FliA binding site (Fitzgerald et al., 2014), plotted 100 bp upstream and downstream of the known/predicted TSS. Predicted TSSs are indicated by the dashed vertical line. Darker green indicates higher sequence read density.
To systematically assess whether FliA binding sites are associated with signal in the NET-seq dataset, the sequence read coverage upstream and downstream of FliA binding sites was determined. For FliA binding sites associated with a TSS, the read coverage at each position from −100 to +100 was determined relative to the TSS. For all other FliA binding sites, a TSS was predicted at 20 bp downstream of the predicted promoter sequence center (average position of other TSSs), and coverage was determined from −100 to +100 relative to this position. The coverage profile for each binding site was normalized to the minimum and maximum coverage in the region and plotted as a heatmap (Figure 2B). There is a clear trend of higher NET-seq read coverage downstream of FliA binding sites, compared to the regions immediately upstream. To quantify this trend, the ratio of NET-seq read coverage upstream and downstream of the TSS was calculated for each putative FliA-dependent promoter. In total, 44 out of the 52 putative promoters showed at least 2-fold higher coverage in the region 100 bp downstream of the TSS than in the region 100 bp upstream of the TSS. These 44 putative promoters included 19 that are intragenic (Table 1). As expected, there is a high degree of overlap between the FliA binding sites with transcriptional activity detected by NET-seq and those detected by TSS association (Table 1).
Table 1.
Intragenic FliA binding sites show evidence of transcriptional activity.
| Putative Promoter1 | β-gal2 | TSS3 | NET-seq4 | RNA-seq5 |
|---|---|---|---|---|
| Intergenic | ||||
| aer* | ✓ | ✓ | ✓ | ✓ |
| fliC* | ✓ | ✓ | ✓ | ✓ |
| flxA* | ✓ | ✓ | ✓ | ✓ |
| modA* | ✓ | ✓ | ✓ | ✓ |
| tar* | ✓ | ✓ | ✓ | ✓ |
| trg* | ✓ | ✓ | ✓ | ✓ |
| ycgR* | ✓ | ✓ | ✓ | ✓ |
| yhjH* | ✓ | ✓ | ✓ | ✓ |
| flgK* | ✓ | ✓ | ✓ | - |
| flgM* | ✓ | ✓ | ✓ | - |
| fliA* | - | ✓ | ✓ | ✓ |
| tsr* | ✓ | - | ✓ | ✓ |
| ves* | ✓ | ✓ | ✓ | - |
| ybhK | ✓ | ✓ | ✓ | - |
| cvrA | - | ✓ | ✓ | - |
| fliD* | - | ✓ | ✓ | - |
| fliL* | - | - | ✓ | - |
| pntA | - | - | ✓ | - |
| ynjH* | - | - | - | ✓ |
| yrfF | ✓ | - | - | - |
| Intragenic Sense | ||||
| (flhC)motA* | ✓ | ✓ | ✓ | ✓ |
| (uhpT) | ✓ | ✓ | ✓ | ✓ |
| (yafY)ykfB* | ✓ | ✓ | ✓ | ✓ |
| (yjdA)yjcZ* | ✓ | ✓ | ✓ | ✓ |
| (evgS) | ✓ | ✓ | ✓ | - |
| (galK) | ✓ | ✓ | ✓ | - |
| (kdsD)kdsC | ✓ | ✓ | ✓ | - |
| (mutY)yggX | ✓ | ✓ | ✓ | - |
| (ygbJ)ygbK | ✓ | ✓ | ✓ | - |
| (metF) | - | ✓ | ✓ | - |
| (rluF) | ✓ | ✓ | - | - |
| (btuB) | - | ✓ | - | - |
| (secD) | - | - | ✓ | - |
| (glyA) | - | - | - | - |
| (proK) | - | - | - | - |
| (ycaD)ycaM | - | - | - | - |
| Intragenic Antisense | ||||
| (hypD) | ✓ | ✓ | ✓ | ✓ |
| (lplA) | ✓ | ✓ | ✓ | - |
| (preT) | ✓ | ✓ | ✓ | - |
| (speA) | ✓ | ✓ | ✓ | - |
| (ybhK) | ✓ | ✓ | ✓ | - |
| (yqjA) | ✓ | ✓ | ✓ | - |
| (holA) | - | ✓ | ✓ | - |
| (otsA) | - | ✓ | ✓ | - |
| (rmuC) | - | ✓ | ✓ | - |
| (hslU) | - | ✓ | - | - |
| (uhpC) | - | - | ✓ | - |
| (ydcU) | - | - | ✓ | - |
| (yjiN) | - | - | ✓ | - |
| (serT)hyaA | - | - | - | - |
| Intergenic (between convergent genes) | ||||
| tsr/yjiZ | - | ✓ | ✓ | - |
| insB-4/cspH | - | - | - | - |
Genes associated with FliA binding sites. Genes in parentheses have an internal FliA binding site; genes not in parentheses start <300 bp downstream of a FliA binding site and are orientated in the same direction as the putative promoter. Asterisks indicate FliA binding sites previously reported to be associated with transcription of an mRNA (Fitzgerald et al., 2014).
Check marks indicate a significant difference in β-galactosidase activity between fliA+ and ΔfliA cells for the corresponding lacZ transcriptional fusion (Figure 1).
Check marks indicate association with a nearby TSS.
Check marks indicate a downstream:upstream (relative to the putative TSS) coverage ratio ≥2.
Check marks indicate regulation of the corresponding gene(s), as determined using RNA-seq (Fitzgerald et al., 2014).
In total, 26 of the 30 intragenic FliA binding sites, and one of the two FliA sites in a convergent intergenic region, show evidence of promoter activity from at least one assay. Table 1 summarizes the existing evidence for these sites. It should be noted that neither the TSS nor NET-seq datasets have matched ΔfliA controls, so it is formally possible that TSSs/transcripts are associated with FliA-independent promoters. However, this is highly unlikely given the position of putative TSSs and the position of NET-seq signal with respect to the predicted FliA promoter sequences. Overall, there is substantial overlap between the sets of putative intragenic promoters that display FliA-dependent activity in promoter fusion assays, those with appropriately positioned TSSs, and those that have high NET-seq read coverage ratios (downstream:upstream).
Most intragenic FliA promoters are not conserved across species
To assess whether intragenic FliA promoters and binding sites are likely to be functionally important, we determined conservation of these sites bioinformatically. The sequence surrounding each of the 52 FliA binding sites previously identified by ChIP-seq (Fitzgerald et al., 2014) was extracted and used as a BLAST query to search genomes from 24 γ-proteobacterial genera (Table S1). All genomes queried encode FliA, except for those of Klebsiella and Raoultella, which were included as controls. If a homologous region was identified, it was scored against the previously determined E. coli FliA position-weight matrix (Fitzgerald et al., 2014). These scores are depicted as a heatmap in Figure 3A, where yellow represents the highest-scoring sites and blue the lowest-scoring. Sites are categorized by location and orientation, and then ranked by total degree of conservation within each category, from left to right. The well-characterized FliA-dependent promoter inside flhC, which drives transcription of the downstream motABcheAW operon, was the most highly conserved. All other well-characterized, flagellar-related FliA promoters were well-conserved at the sequence level, with the exception of the promoter upstream of the fliLMNOPQR operon, which is also transcribed by σ70 in E. coli. Most novel intergenic and intragenic FliA binding sites showed no evidence of conservation, even in close relatives such as Salmonella. It should be noted that a few intragenic FliA binding sites, such as those inside hslU, glyA, and ybhK, appear conserved, but score equally well in species that lack fliA (Klebsiella and Raoultella), suggesting they are maintained for reasons independent of their ability to bind FliA, most likely because of high levels of conservation for these protein-coding genes. A few other intragenic promoters, such as those inside uhpC, hypD, metF, and speA, show possible sequence conservation in Salmonella, but not in more distantly related genera.
Figure 3. Sequence conservation of FliA binding sites between E. coli and related bacterial species.

(A) Heat-map depicting the match to the FliA consensus binding site for regions in the genomes of a range of bacterial species, where the region analyzed is homologous to a region surrounding a FliA binding site in E. coli. Genera are listed on the left. E. coli genes associated with the binding sites are listed across the top of the heat-map. FliA binding sites are grouped by location/orientation category, as indicated by category labels across the bottom of the heat-map. Genes containing FliA binding sites are listed in parentheses. Genes not in parentheses are downstream of the corresponding FliA binding site. The color scale indicating the strength of the sequence match is shown next to the heat-map. Empty squares in the heat-map indicate that the corresponding genomic region in E. coli is not sufficiently conserved in the species being analyzed. (B) Conservation of FliA sites across 9,432 E. coli strains. For each site from E. coli K-12, conservation was determined at each position within the site for all strains of E. coli where the surrounding sequence is conserved. Thus, the fraction of genomes in which each base is conserved was calculated. Values plotted represent the average (mean) level of conservation for (i) 18 FliA sites that represent promoters for mRNAs (filled circles; Table 1), and (ii) the remaining 34 FliA sites (empty circles). The FliA binding motif is shown above the graph as a reference point for each of the site positions.
Intragenic FliA promoters are not conserved across E. coli strains
Previous studies suggest that while intragenic promoters may not be conserved between species (Raghavan et al., 2012), they may be conserved within strains of the same species (Shao et al., 2014). Hence, we bioinformatically determined the conservation of all FliA sites across 9,432 E. coli strains for which a genome sequence is available (Table S2). The sequence surrounding each of the 52 FliA binding sites previously identified by ChIP-seq (Fitzgerald et al., 2014) was extracted and used as a BLAST query to search genomes from each E. coli genome contig. If a homologous region was identified, we determined whether each position in each E. coli K-12 FliA site is conserved. We then determined the proportion of strains with a homologous region in which each position of each FliA site is conserved. Figure 3B shows the level of conservation of each position of FliA sites divided into two classes: (i) sites that represent promoters of mRNAs (based on our previous RNA-seq data and other studies of the FliA regulon (Fitzgerald et al., 2014)), and (ii) all other sites. The second class includes most of the intragenic FliA sites. FliA sites that represent promoters of mRNAs are highly conserved in the −10 and −35 regions, but less well conserved in the spacer region (Figure 3B), consistent with the lack of sequence requirements in the spacer region for FliA binding. By contrast, FliA sites that do not represent promoters for mRNAs are less well conserved in the −10 and −35 regions, and show no difference in conservation between these regions and the spacer. We conclude that, as a group, FliA binding sites that do not represent mRNA promoters are not under purifying selection.
Genome-wide mapping of the Salmonella Typhimurium FliA regulon
Salmonella enterica and E. coli diverged approximately 100 million years ago and exhibit substantial drift at wobble positions (Gordienko et al., 2013). As an independent, empirical test of FliA binding site conservation, we determined the genome-wide binding profile of S. enterica serovar Typhimurium FliA using ChIP-seq of a C-terminally tagged derivative expressed from its native locus. To facilitate comparison with E. coli ChIP-seq data, we grew cells under similar conditions as those used in our previous study of E. coli FliA (Fitzgerald et al., 2014). A total of 23 high-confidence FliA binding sites were identified (Table 2, Figure 4A). Of these 23 sites, three are inside genes but within 300 bp of a gene start (13%; Figure 4B), and five are inside genes and far from a gene start (22%). No equivalent ChIP-seq peaks were identified using a control, untagged strain of S. Typhimurium. All 23 S. Typhimurium FliA binding sites are associated with a match to the consensus FliA motif (Figure 4C; MEME, E-value = 7.4e−49), and motif positions were enriched in the region ~25 bp upstream of peak centers, as previously described for FliA binding sites in E. coli (Fitzgerald et al., 2014). As predicted by the sequence conservation analysis (Figure 3A), FliA-dependent promoters upstream of key flagellar operons were conserved in S. Typhimurium. However, with the exception of the motA promoter that is located inside flhC, no intragenic FliA binding sites were found to be conserved between E. coli and S. Typhimurium.
Table 2.
FliA regulon of Salmonella Typhimurium 14028s.
| Peak Center1 | FAT2 | Motif Center3 | Motif Strand4 | Motif5 | Gene(s)6 | Expression (wt)7 | Expression (ΔfliA)7,8 |
|---|---|---|---|---|---|---|---|
| 624724 | 29 | 624746 | − | TAAAAAGAAAAGAGTGCGCGCCGATATA | STM14_0662 | 115 | 68* |
| 845911 | 8 | 845901 | + | TCAAGATCCTGCTTTTCCTGCCGATATT | modA | 120 | 37* |
| 1215557 | 9 | 1215575 | − | TAAAGATTTTGTCGCGGCTGCCGATGAG | flgM | 776 | 163* |
| 1223602 | 5 | 1223586 | + | TCAAGTCCACGTAGTCGCTGCCGATAAC | flgK | 943 | 185* |
| 1727514 | 4 | 1727546 | − | TAAGCAAACGTCACGAAGTGCCGATGAC | trg | 185 | 1* |
| 1907932 | 58 | 1907909 | + | TTAAGTTCTTTCTACCGATGCCGATAAC | ycgR | 179 | 2* |
| 2027840 | 8 | 2027866 | − | TAAAGTTATCACCGCAGGTGCCGATAAC | cheM | 370 | 1* |
| 2031328 | 1 | 2031360 | − | TAAAGAATTAATTCAGATTGCCGAATAT | (motB) | (572) | (7)* |
| 2032570 | 8 | 2032596 | − | TAAACTTTCCCGAGATGCTGCCGATATT | (flhC)motA | (311)483 | (228)8* |
| 2056900 | 7 | 2056910 | − | TGTAGAAACGGATAATCATGCCGATAAC | fliA | − | − |
| 2060603 | 10 | 2060633 | − | TAAAGTTCGAAATTCAGGTGCCGATACA | fliC | 11938 | 25* |
| 2060764 | 6 | 2060755 | + | TAAACTTTGCCTCCAGATTGCCGATAAC | fliD | 1478 | 219* |
| 2472155 | 1 | 2472147 | + | TCCATTTTTTGTCCTCATTGCCGATAAC | STM14_2852 | 932 | 16* |
| 2728195 | 1 | 2728218 | − | AAAACTGTTCCTGTGCTGCGCCGATAAT | (pepB) | (65) | (119) |
| 2935946 | 23 | 2935935 | + | TAAAGTTTATGCCTCAAGTGTCGATAAC | (STM14_3340) fljBA | (280)1954 | (7)*13* |
| 3334267 | 2 | 3334287 | − | TATATATTCTCCGCGCCTTGCCGATAAC | STM14_3817 | 48 | 5* |
| 3400660 | 9 | 3400673 | − | TAAAGTTAGTAACATTATTGCCGATAAA | STM14_3893 | 863 | 11* |
| 3402562 | 2 | 3402592 | − | TAAAGATAAATAGATTAGCGCCGAAATA | (STM14_3895) aer | (5)185 | (7)4* |
| 3504766 | 2 | 3504795 | − | TAAAAAATTCTGGGATGCCACCGATAAA | (arcB) | (228) | (308) |
| 3559655 | 4 | 3559683 | − | TAACAAAATGCTCGATCGTGACGATATG | (yhdA) | (72) | (47) |
| 3801092 | 34 | 3801114 | − | TAAAGTTCTCTGCCTGAACGCCGATAAC | yhjH | 318 | 2* |
| 4531425 | 5 | 4531410 | + | TCAACCCGAACAATAAATTGCCGATAAC | (nrfB) | (414) | (191)* |
| 4802894 | 10 | 4802872 | + | TAAAGTTTTCCCTTTCCAGGCCGAAAAT | tsr | 450 | 8* |
Genome coordinate of the ChIP-seq peak center. Coordinates are relative to the 14028s chromosomal reference sequence (NC_003198.1).
Fold Above Threshold (FAT) score, a measure of relative ChIP-seq enrichment.
Genome coordinate of the sequence motif identified using MEME. Coordinates are relative to the 14028s chromosomal reference sequence (NC_003198.1).
Genomic strand of the sequence motif identified using MEME.
Sequence of the motif identified using MEME.
For intergenic FliA binding sites, the downstream gene is listed. Genes containing intragenic FliA binding sites are listed in parentheses. Underlining indicates that the putative promoter is in the antisense orientation relative to the overlapping gene. If a gene start is located within 300 bp of a putative intragenic FliA promoter, that gene name is listed as well.
Normalized expression values for the indicated genes, as determined by RNA-seq.
Asterisks indicate significant differential expression between wild-type and ΔfliA cells (q < 0.01).
Figure 4. Identification of FliA binding sites in Salmonella Typhimurium using ChIP-seq.

(A) Sequence read coverage across the S. Typhiumurium genome for a FliA ChIP-seq dataset. Annotated genes are indicated by gray bars. The green graph shows relative sequence read coverage, with “spikes” corresponding to sites of FliA association. (B) Pie-chart showing the distribution of identified FliA binding sites relative to genes. “Inside” = FliA binding within a gene. “Upstream” = FliA binding upstream of a gene. “Inside + us” = FliA binding within a gene but within 300 bp of a downstream gene start. (C) Enriched sequence motif associated with FliA binding sites identified by ChIP-seq. (D) Distribution of motifs relative to ChIP-seq peak centers for all FliA binding sites identified by ChIP-seq. Motifs are enriched in the region ~25 bp upstream of the peak center, relative to the motif orientation.
RNA-seq was used to assess FliA-dependent changes in gene expression by comparing wild-type and ΔfliA strains of S. Typhimurium (Figure 5). As for the ChIP-seq experiment, cells were grown under similar conditions as those used in our previous study of E. coli FliA (Fitzgerald et al., 2014). Overall, 344 genes were significantly differentially expressed between the two strains (q-value ≤ 0.01, fold-change ≥ 2), of which 36 were downstream of FliA binding sites identified by ChIP-seq (Table 2). The intragenic FliA binding sites within flhC, STM14_3340, and STM14_3895 were associated with FliA-dependent regulation of the downstream genes, all of which are known flagellar genes. The other intragenic binding sites were not associated with detectable transcripts.
Figure 5. Transcriptome analysis of the FliA regulon in Salmonella Typhimurium.

The scatter-plot shows normalized expression (see Methods) for each gene in S. Typhimurium for wild-type cells (14028s; x-axis) or ΔfliA cells (DMF088; y-axis). Gray dots represent genes that are not associated with a FliA binding site and are not significantly differentially expressed between wild-type and ΔfliA cells. Black dots represent genes that are not associated with a FliA binding site and are significantly differentially expressed between wild-type and ΔfliA cells. Green circles represent genes that are associated with an upstream FliA binding site. Green triangles represent genes that are associated with an internal FliA binding site. Filled green circles/triangles indicate genes that are significantly differentially expressed between wild-type and ΔfliA cells. Empty green circles/triangles represent genes that are not differentially expressed between wild-type and ΔfliA cells.
The motA promoter within flhC constrains evolution of the FlhC protein
Although most intragenic FliA promoters in E. coli are not well conserved in other species, the motA promoter, located inside flhC, is highly conserved (Figure 3A). However, it is unclear whether this conservation is due to selective pressure on the promoter or on the amino acid sequence of FlhC, which is encoded by the same DNA. As expected given the conservation of the motA promoter inside flhC, the two FlhC amino acids, Ala177-Asp178, that are encoded by sequence overlapping the −10 region, are highly conserved among γ-proteobacteria (Figure 6A; Table S3). Strikingly, the amino acids flanking the Ala-Asp sequence are poorly conserved (Figure 6A), leading us to hypothesize that the Ala-Asp motif is conserved due to selective pressure on the motA promoter, rather than on the amino acids themselves. To test this hypothesis, we determined whether Asp178 is required for FlhC function. We created a strain of motile E. coli MG1655 in which the flhDC promoter is transcriptionally active, but flhC is replaced with a cassette containing thyA under the control of a constitutive σ70 promoter. Thus, this strain lacks the motA promoter, but we reasoned that motA would be co-transcribed with thyA (Figure 6B). We then introduced either wild-type FlhC or D178A FlhC from a plasmid, or an empty vector control. Cells containing the empty vector control were non-motile, as expected given that they lack FlhC (Figure 6B). By contrast, cells expressing wild-type FlhC from the plasmid were fully motile. Strikingly, cells expressing D178A FlhC were also fully motile (mean motility level relative to wild-type FlhC of 0.97 ± s.d. 0.09, n = 3; Figure 6B). We conclude that the conserved Asp178 is likely not required for FlhC function.
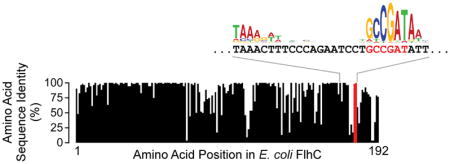
Figure 6. The FliA promoter within flhC constrains evolution of FlhC amino acid sequence.

(A) Sequence conservation of FlhC amino acid sequence between E. coli and 51 other γ-proteobacterial species. The graph indicates the level of identity across all species analyzed for each amino acid in FlhC; data for Ala177 and Asp178 are highlighted in red. The nucleotide sequence of flhC in the motA promoter region is indicated, aligned with the previously reported FliA binding motif logo (Fitzgerald et al., 2014). Codons 177 and 178 are shown in red. (B) Motility assay for ΔflhC::thyA E. coli (CDS105) containing either empty vector (pBAD30), or plasmid expressing wild-type FlhC (pCDS043) or D178A mutant FlhC (pCDS044). Dashed red circles indicate the inoculation sites. Plates were incubated for 7 hours. The schematic to the left of the plate image shows how the strain was constructed. (C) Enriched sequence motif found in the flhC-motA intergenic regions of species in which FlhC Asp178 is not conserved. This motif is a close match to the known FliA binding site consensus.
To further investigate the conservation of the Ala-Asp motif in FlhC, we aligned the sequences of FlhC homologues from 98 different proteobacterial species, each from a different genus in which motA is positioned immediately downstream of flhC (Table S4). Although Ala177 and Asp178 are well conserved across these species (conserved in 70% and 56% of species, respectively), we identified 44 species in which Asp178 is not conserved (Table S4). We reasoned that if Asp178 is broadly conserved due to selective pressure on the overlapping motA promoter, species in which Asp178 is not conserved are likely to have repositioned the motA promoter. To test this hypothesis, we extracted the intergenic sequences between flhC and motA for each of the 43 species where Asp178 is not conserved (Figure S1). Consistent with our hypothesis, we identified a strongly enriched sequence motif in 19 species (MEME E-value = 1.5e−32) corresponding to a consensus FliA promoter (Figure 6C). By contrast, when we repeated this analysis for the 55 species where Asp178 is conserved (Figure S1), we did not observe enrichment of a FliA promoter motif in the flhC-motA intergenic region. Having a FliA promoter for motA within flhC is likely to be the ancestral state, since the position of FliA promoters in flhC-motA intergenic regions differs extensively between species, as do the sequences flanking these promoters. We also compared the length of the flhC-motA intergenic region in (i) the 19 species where FlhC Asp178 is not conserved and for which we identified a likely intergenic FliA promoter, and (ii) the 55 species where FlhC Asp178 is conserved. Intergenic distances in group (i) are significantly higher (median length 207 bp) than those in group (ii) (median length 131 bp; Mann-Whitney U Test p = 4.0e−7). We conclude that the selective pressure on Asp178 is lost in species that reposition the motA promoter to the flhC-motA intergenic region, and that this repositioning likely occurs by sequence insertion.
DISCUSSION
Most FliA Binding Sites are Active Promoters for Unstable RNAs
Most FliA binding sites identified by ChIP-seq display FliA-dependent promoter activity when fused upstream of the lacZ reporter gene (Figure 1). Many of these FliA binding sites, and some additional sites that had inactive lacZ fusions, are associated with correctly positioned TSSs and NET-seq signal from published studies (Larson et al., 2014; Thomason et al., 2015). Together, these data suggest that almost all FliA binding sites represent transcriptionally active FliA-dependent promoters, regardless of their location relative to protein-coding genes. The small subset of FliA binding sites that appear to be transcriptionally inert were amongst the most weakly bound sites detected by ChIP-seq (Fitzgerald et al., 2014). Three of these sites have at least one mismatch to key −10 region residues (Koo, Rhodius, Campbell, et al., 2009), suggesting that the sites are unlikely to be active promoters, or are so weakly transcribed that their activity is undetectable using standard assays.
Although most intragenic FliA binding sites are likely to represent active promoters, they are not associated with the transcription of stable RNAs, since we previously detected very few such RNAs using standard RNA-seq (Fitzgerald et al., 2014). We conclude that most intragenic FliA promoters drive transcription of unstable RNAs. This is consistent with the previously described phenomenon of “pervasive transcription” that generates large numbers of short, unstable transcripts, primarily from promoters within genes (Lybecker et al., 2014; Wade and Grainger, 2014). Intragenic promoters typically drive transcription of non-coding RNAs. Transcription of these RNAs is rapidly terminated by Rho (Peters et al., 2012), and the transcripts are rapidly degraded by RNases (Lybecker et al., 2014; Wade and Grainger, 2014).
Limited conservation of the FliA regulon outside of core flagellar genes
Evolutionary conservation of DNA sequences is due to purifying selection, and suggests that the sequence has beneficial function.. As expected, most flagella-associated FliA promoters are highly conserved at the sequence level (Figure 3). Of the intragenic FliA binding sites, only those that drive transcription of an mRNA for a downstream gene appear to be at all functionally conserved. A few intragenic promoters, such as those within hslU, glyA, and ybhK, are conserved at the sequence level between E. coli and many species (Figure 3A). However, the fact that these sites are also conserved in two genera not encoding fliA – Klebsiella and Raoultella – suggests that the DNA sequences are maintained for reasons independent of FliA, most likely purifying selection on the codons for the overlapping protein-coding genes.
To experimentally validate the sequence-based conservation predictions, we performed ChIP-seq on S. Typhimurium FliA. As predicted based on sequence conservation, all key flagellar promoters were functionally conserved, except the one upstream of fliLMNOPQR. In E. coli, this operon is primarily transcribed from a σ70 promoter that is activated by FlhDC (Liu and Matsumura, 1996; Stafford et al., 2005; Fitzgerald et al., 2014). Conservation of the σ70 promoter and FlhDC regulation would ensure that these genes are coordinately regulated with other flagellar genes in S. Typhimurium, potentially relieving the selective pressure to maintain the FliA promoter. Our ChIP-seq data indicate the only intragenic FliA promoter functionally conserved between E. coli and S. Typhimurium is that within flhC. While specific intragenic FliA binding sites were not conserved, S. Typhimurium FliA binds multiple intragenic sites. This suggests that the factors affecting FliA specificity, or lack thereof, are similar between E. coli and S. Typhimurium, and that the phenomenon of intragenic FliA promoters is conserved, even if the specific promoters are not. Note that we identified fewer intragenic FliA sites in S. Typhimurium than we previously identified in E. coli (Fitzgerald et al., 2014), but this is likely due to the data for S. Typhimurium having slightly lower signal-to-noise ratios (compare ChIP-seq enrichment (“FAT”) scores in Table 2 to those in our previous study (Fitzgerald et al., 2014)).
It should be noted that lack of conservation of specific promoters does not necessarily indicate a lack of functional importance, but could instead reflect lineage-specific evolution. Indeed, regulatory small RNAs are often poorly conserved, even between closely related species (Toffano-Nioche et al., 2012; Beauregard et al., 2013; Patenge et al., 2015). However, our analysis of conservation within E. coli suggests that most intragenic FliA promoters are not conserved even within the species, although this multi-promoter analysis does not rule out the possibility that a small proportion of the intragenic promoters are functional. Indeed, one of the two stable, FliA-transcribed non-coding RNAs – that transcribed from within uhpT – is likely a functional regulator. A recent study detected numerous Hfq-mediated interactions between mRNAs and RNA originating from the 3′ end of uhpT (Melamed et al., 2016). Although the uhpT sequences from these interactions map to locations downstream of the sRNA predicted by RNA-seq (Fitzgerald et al., 2014), an earlier microarray study and NET-seq data suggest that the FliA-transcribed sRNA extends further downstream (Reppas et al., 2006; Larson et al., 2014). The other stable, FliA-transcribed non-coding RNA – that transcribed from within hypD – was not detected in any sRNA:mRNA interactions (Melamed et al., 2016), suggesting that it is not functional. Unstable FliA-transcribed non-coding RNAs are also unlikely to be functional, given their transient nature, and the lack of promoter conservation.
Intragenic FliA promoters likely arise as a result of sequence drift during evolution, although the likelihood of creating a FliA promoter as a result of a base substitution is lower than for some other σ factors, since FliA promoters require a more stringent match to the consensus sequence. Nonetheless, we estimate that there are 474 possible single base substitutions in the E. coli genome that would create a new FliA promoter (see Methods). Strikingly, this number is similar to the number of single base substitutions that we predict would destroy an existing FliA site, based on the number of actual FliA sites and the information content of the binding motif. We propose that the number of intragenic FliA sites in E. coli is in equilibrium, but that non-functional sites turn over relatively frequently. The prevalence of intragenic FliA promoters in E. coli and S. Typhimurium suggests that they do not substantially impact expression of the overlapping genes. Consistent with this, we detected significant FliA-dependent regulation of only three S. Typhimurium genes that have an internal FliA site (Figure 5; Table 2); one of these genes (STM14_3340) is immediately upstream of a FliA-transcribed flagellar gene, and another (motB) is a downstream gene in a FliA-transcribed operon. While most intragenic FliA promoters are unlikely to be individually functional, the phenomenon of widespread intragenic FliA sites may be functional. For example, intragenic FliA sites could titrate cellular FliA, thereby sensitizing other FliA promoters to the level of FliA expression (Brewster et al., 2014). Alternatively, titration of FliA could reduce stochasticity in effective FliA levels, by requiring that FliA levels be maintained at higher levels. These functions would be independent of the specific locations of FliA promoters, and more dependent on the number and strength of promoters. Spontaneous creation of FliA binding sites by genetic drift may also provide a source of novel, functional FliA promoters, e.g. if there is a selective advantage of coordinately regulating the downstream gene with flagellar genes.
The motA promoter inside flhC constrains the evolution of FlhC
Although most intragenic FliA promoters are not conserved, the promoter within flhC is the most highly conserved of all FliA promoters. This promoter has been described previously, and drives transcription of the motAB-cheAW operon mRNA (Ide et al., 1999; Park et al., 2001; Fitzgerald et al., 2014). FliA promoters require a stringent match to the consensus promoter sequence (Koo, Rhodius, Campbell, et al., 2009), and this is reflected by the high information content in the sequence motif associated with FliA binding, especially in the −10 region (Figure 4C) (Fitzgerald et al., 2014). Hence, conservation of an intragenic FliA promoter is likely to result in conservation of the amino acid sequence for the overlapping codons. The −10 region of the FliA promoter in flhC corresponds to an Ala-Asp motif in the FlhC protein. This motif is broadly conserved. Multiple independent lines of evidence support the idea that the Ala-Asp sequence motif is conserved due to selective pressure on the intragenic FliA promoter and not on the amino acids themselves: (i) amino acids close to the Ala-Asp motif that are not associated with FliA promoter elements are poorly conserved (Figure 6A); (ii) the Ala-Asp motif is not present in the X-ray crystal structure of FlhDC (Wang et al., 2006), suggesting that it is in a disordered region; (iii) Asp178 does not detectably contribute to FlhC function (Figure 6B); and (iv) in proteobacterial species where flhC and motA are adjacent genes but FlhC Asp178 is not conserved, an alternative FliA promoter is often located in the intergenic region between flhC and motA (Figure 6C). Thus, even in cases where the specific FliA promoter inside flhC is not conserved, the presence of a FliA promoter upstream of motA is conserved. If the FliA promoter inside flhC were conserved because of selective pressure on the Ala-Asp motif, we would expect that (i) surrounding amino acids would also be conserved, regardless of whether they are encoded in sequence overlapping key FliA promoter elements, (ii) the Ala-Asp motif would be part of an important structural motif, (iii) Asp178 would be required for motility, and (iv) in species where Asp178 is not conserved, there would be no selective pressure to acquire an alternative FliA promoter for motA. We therefore conclude that the amino acid sequence of FlhC is constrained by the internal promoter for motA. Thus, the evolution of FlhC protein sequence is directly impacted by the function of the downstream gene.
The potential for an abundance of bacterial regulatory sequences that constrain protein evolution
A recent study reported large numbers of putative transcription factor binding sites in the coding sequences of the human genome, and suggested that these sequences are under selective pressure for both their regulatory and coding functions (Stergachis et al., 2013). While the specific findings of that study have been questioned (Xing and He, 2015), the FliA promoter inside flhC is clearly analogous. We propose that conservation of intragenic sequences due to selective pressure on their regulatory function is likely to occur far more frequently in bacteria than in eukaryotes. The compact nature of bacterial genomes causes them to be gene-dense, greatly limiting the non-coding sequence space; in E. coli, ~90% of the genome is protein-coding, in stark contrast to the human genome, which is <2% protein-coding. Consistent with the paucity of non-coding sequence in bacterial genomes, numerous intragenic binding sites have been identified for transcription factors and σ factors (Wade et al., 2006; Shimada et al., 2008; Hartkoorn et al., 2012; J. Galagan et al., 2013; J. E. Galagan et al., 2013; Bonocora et al., 2013; Wade and Grainger, 2014; Bonocora et al., 2015; Grainger, 2016). In some cases, low stringency in the DNA sequence requirements for binding may allow for sequence changes that change encoded amino acids while maintaining regulatory function. For example, there are many intragenic σ70 promoters in E. coli (Singh et al., 2014), but σ70 promoters can still be active with multiple mismatches to the consensus (Singh et al., 2014). Hence, even if an intragenic σ70 promoter is under selective pressure, it could acquire mutations that alter the overlapping coding potential without affecting promoter strength. However, bacterial transcription factors and some alternative σ factors tend to have high information content binding sites, especially compared to their eukaryotic equivalents (Wade et al., 2005; Wunderlich and Mirny, 2009). This suggests that functional conservation of intragenic transcription/σ factor binding sites in bacteria will often constrain evolution of the overlapping gene.
Identification of regulatory sequences that constrain protein evolution requires further investigation of intragenic regulatory sites. Although numerous intragenic binding sites have been identified, their regulatory capacity is often unclear, and their conservation has not been extensively analyzed. Intragenic promoters have been reported in numerous bacterial species (Lybecker et al., 2014; Wade and Grainger, 2014). Limited evolutionary analysis suggests that most promoters for antisense RNAs are not conserved (Raghavan et al., 2012), although there is evidence for lineage-specific conservation (Shao et al., 2014). Importantly, there are specific examples of intragenic σ factor binding that likely constrain evolution of the amino acid sequence encoded by the overlapping protein-coding gene. First, an intragenic promoter for the alternative σ factor, σ24, is conserved both at the sequence level and functionally (Guo et al., 2014; Li et al., 2015). This promoter drives transcription of a non-coding, regulatory RNA, MicL, that is also conserved (Guo et al., 2014). Hence, both the promoter and non-coding RNA might represent dual-usage sequence. Second, an alternative σ factor, σ54, binds many intragenic sites in E. coli and S. Typhimurium that are conserved both at the sequence level and functionally (Bonocora et al., 2015; Bono et al., 2017), suggesting that they may constrain protein evolution. Since conserved intragenic σ54 binding sites are likely to be promoters for downstream genes (Bonocora et al., 2015), evolution of the amino acid sequence of proteins encoded by genes containing σ54 promoters may often be constrained by the function of the downstream gene.
Extrapolating from our data for FliA, the majority of intragenic transcription/σ factor binding sites are likely to be non-functional, and hence not under selective pressure. These sites would therefore not impact protein evolution. Even though the complete regulons of most E. coli transcription/σ factors remain to be mapped, thousands of intragenic sites have already been identified, implying that there are thousands more sites yet to be discovered. Even if only a small fraction of intragenic sites are under selection, this would indicate the existence of many such sequences that constrain protein evolution. Hence, our data suggest that the evolutionary impact of intragenic regulatory sequences should be considered more broadly, as it is likely to be an important factor shaping bacterial genome evolution.
MATERIALS AND METHODS
Strains, plasmids, and growth conditions
All bacterial strains and plasmids used in this study are listed in Table 3. All oligonucleotides used in this study are listed in Table S5. All E. coli strains are derivatives of the motile MG1655 strain (DMF36) described previously (Fitzgerald et al., 2014). To construct strains used for β-galactosidase assays, the native lacZ gene of DMF36, or the isogenic ΔfliA strain (DMF40) (Fitzgerald et al., 2014) was replaced by thyA using FRUIT recombineering (Stringer et al., 2012) with oligonucleotides JW5397 and JW5398, generating strains DMF122 and DMF123, respectively. flhC and 106 bp downstream sequence was replaced with thyA in DMF36 using FRUIT recombineering (Stringer et al., 2012) to generate strain CDS105. Salmonella strains are derivatives of S. enterica serovar Typhimurium 14028s (Jarvik et al., 2010). S. Typhimurium FliA was N-terminally epitope tagged with a 3x-FLAG tag at the native chromosomal locus using FRUIT recombineering (Stringer et al., 2012), generating strain DMF087. The S. Typhimurium ΔfliA strain, DMF088, was constructed using FRUIT recombineering (Stringer et al., 2012).
Table 3.
Strains and Plasmids used in this study.
| Strains | ||
|---|---|---|
| Name | Description | Source |
| DMF36 | Motile Escherichia coli MG1655 | (Fitzgerald et al., 2014) |
| DMF122 | DMF36 ΔlacZ | This study |
| DMF123 | DMF123 ΔfliA | This study |
| CDS105 | DMF36 ΔthyA flhC::thyA | This study |
| 14028s | Wild-type Salmonella Typhimurium | (Jarvik et al., 2010) |
| DMF087 | 14028s FLAG3-fliA | This study |
| DMF088 | 14028s ΔfliA | This study |
| Plasmids | |||
|---|---|---|---|
| Name | Description | Oligonucleotides used for Cloning | Source |
| pAMD-BA-lacZ | Single-copy lacZ expression vector (camR) | n/a | (Stringer et al., 2014) |
| pDMF35 | pAMD-BA-lacZ with FliA promoter (yafY)ykfB | JW5523/JW5567 | This study |
| pDMF36 | pAMD-BA-lacZ with FliA promoter (secD) | JW5356/JW5357 | This study |
| pDMF37 | pAMD-BA-lacZ with FliA promoter (holA) | JW5352/JW6127 | This study |
| pDMF38 | pAMD-BA-lacZ with FliA promoter (galK) | JW5524/JW5568 | This study |
| pDMF39 | pAMD-BA-lacZ with FliA promoter modA | JW5525/JW5569 | This study |
| pDMF40 | pAMD-BA-lacZ with FliA promoter (ybhK) | JW5526/JW6130 | This study |
| pDMF41 | pAMD-BA-lacZ with FliA promoter ybhK | JW5527/JW5571 | This study |
| pDMF42 | pAMD-BA-lacZ with FliA promoter (ycaD)ycaM | JW5528/JW6132 | This study |
| pDMF43 | pAMD-BA-lacZ with FliA promoter (serT)hyaA | JW5529/JW5573 | This study |
| pDMF44 | pAMD-BA-lacZ with FliA promoter insB-4/cspH | JW5530/JW5574 | This study |
| pDMF45 | pAMD-BA-lacZ with FliA promoter flgM | JW5531/JW6135 | This study |
| pDMF46 | pAMD-BA-lacZ with FliA promoter flgK | JW5532/JW6136 | This study |
| pDMF47 | pAMD-BA-lacZ with FliA promoter cvrA | JW5533/JW5577 | This study |
| pDMF48 | pAMD-BA-lacZ with FliA promoter ycgR | JW5534/JW6138 | This study |
| pDMF49 | pAMD-BA-lacZ with FliA promoter trg | JW5535/JW5579 | This study |
| pDMF50 | pAMD-BA-lacZ with FliA promoter (ydcU) | JW5536/JW5580 | This study |
| pDMF51 | pAMD-BA-lacZ with FliA promoter flxA | JW5537/JW5581 | This study |
| pDMF52 | pAMD-BA-lacZ with FliA promoter pntA | JW5538/JW5582 | This study |
| pDMF53 | pAMD-BA-lacZ with FliA promoter ves | JW5539/JW6143 | This study |
| pDMF54 | pAMD-BA-lacZ with FliA promoter ynjH | JW5540/JW6144 | This study |
| pDMF55 | pAMD-BA-lacZ with FliA promoter tar | JW5541/JW6145 | This study |
| pDMF56 | pAMD-BA-lacZ with FliA promoter (flhC)motA | JW5542/JW5586 | This study |
| pDMF57 | pAMD-BA-lacZ with FliA promoter (otsA) | JW5543/JW6147 | This study |
| pDMF58 | pAMD-BA-lacZ with FliA promoter fliA | JW5544/JW5588 | This study |
| pDMF59 | pAMD-BA-lacZ with FliA promoter fliC | JW5342/JW5343 | This study |
| pDMF60 | pAMD-BA-lacZ with FliA promoter fliD | JW5545/JW6150 | This study |
| pDMF61 | pAMD-BA-lacZ with FliA promoter fliL | JW5546/JW6151 | This study |
| pDMF62 | pAMD-BA-lacZ with FliA promoter (preT) | JW5547/JW6152 | This study |
| pDMF63 | pAMD-BA-lacZ with FliA promoter (evgS) | JW5548/JW5592 | This study |
| pDMF64 | pAMD-BA-lacZ with FliA promoter (glyA) | JW5549/JW6154 | This study |
| pDMF65 | pAMD-BA-lacZ with FliA promoter (hypD) | JW5348/JW5349 | This study |
| pDMF66 | pAMD-BA-lacZ with FliA promoter (ygbJ)ygbK | JW5550/JW5594 | This study |
| pDMF67 | pAMD-BA-lacZ with FliA promoter (speA) | JW5350/JW5351 | This study |
| pDMF68 | pAMD-BA-lacZ with FliA promoter (mutY)yggX | JW5551/JW6158 | This study |
| pDMF69 | pAMD-BA-lacZ with FliA promoter aer | JW5552/JW5596 | This study |
| pDMF70 | pAMD-BA-lacZ with FliA promoter (yqjA) | JW5553/JW5597 | This study |
| pDMF71 | pAMD-BA-lacZ with FliA promoter (kdsD)kdsC | JW5554/JW5598 | This study |
| pDMF72 | pAMD-BA-lacZ with FliA promoter yrfF | JW5344/JW5345 | This study |
| pDMF73 | pAMD-BA-lacZ with FliA promoter yhjH | JW5555/JW5599 | This study |
| pDMF74 | pAMD-BA-lacZ with FliA promoter (proK) | JW5556/JW6164 | This study |
| pDMF75 | pAMD-BA-lacZ with FliA promoter (uhpT) | JW5346/JW5347 | This study |
| pDMF76 | pAMD-BA-lacZ with FliA promoter (uhpC) | JW5557/JW5601 | This study |
| pDMF77 | pAMD-BA-lacZ with FliA promoter (rmuC) | JW5558/JW5602 | This study |
| pDMF78 | pAMD-BA-lacZ with FliA promoter (hslU) | JW5559/JW6168 | This study |
| pDMF79 | pAMD-BA-lacZ with FliA promoter (metF) | JW5560/JW6169 | This study |
| pDMF80 | pAMD-BA-lacZ with FliA promoter btuB | JW5561/JW5605 | This study |
| pDMF81 | pAMD-BA-lacZ with FliA promoter (rluF) | JW5354/JW5355 | This study |
| pDMF82 | pAMD-BA-lacZ with FliA promoter (yjdA)yjcZ | JW5562/JW5606 | This study |
| pDMF83 | pAMD-BA-lacZ with FliA promoter (yjiN) | JW5563/JW5607 | This study |
| pDMF84 | pAMD-BA-lacZ with FliA promoter tsr | JW5564/JW6174 | This study |
| pDMF85 | pAMD-BA-lacZ with FliA promoter tsr/yjiZ convergent | JW5565/JW6175 | This study |
| pDMF86 | pAMD-BA-lacZ with FliA promoter (lplA) | JW5566/JW6176 | This study |
| pBAD30 | Empty pBAD30 | n/a | (Guzman et al., 1995) |
| pCDS043 | pBAD30-flhC | JW8879/8880 | This study |
| pCDS044 | pBAD30–D178A flhC | JW8879/8881 | This study |
Wild-type flhC was PCR-amplified using oligonucleotides JW8879 and JW8880, and cloned into the SacI and SalI restriction sites of pBAD30 (Guzman et al., 1995) using the In-Fusion method (Clontech) to generate pCDS043. D178A mutant flhC was PCR-amplified using oligonucleotides JW8879 and JW8881, and cloned as described for wild-type fhlC, to generate pCDS044. Transcriptional fusions of putative FliA promoters to lacZ were constructed in plasmid pAMD-BA-lacZ (Stringer et al., 2014). Putative promoter regions (nucleotide positions −200 to +10, relative to the predicted TSS) were PCR-amplified from MG1655 cells. PCR products were cloned into pAMD-BA-lacZ cut with SphI and NheI using the In-Fusion method (Clontech). Oligonucleotides used for the plasmid cloning are listed in Table 3.
For all experiments involving liquid growth, subcultures were grown in LB at 37 °C, with aeration, to OD600 0.5–0.7.
β-galactosidase assays
Transcriptional lacZ promoter fusion plasmids were transformed into ΔlacZ strains with (DMF122) or without fliA (DMF123). Promoter activity was assessed by β-galactosidase assay, as previously described (Stringer et al., 2014).
Analysis of published TSS data
To determine whether FliA binding sites were associated with TSSs, a published list of TSS locations derived from dRNA-seq was used (Thomason et al., 2015). Orientation of putative FliA promoters was determined based on associated motifs. For each putative FliA promoter, the distance from the motif center to each downstream TSS on the correct strand was calculated. All pairwise distances <500 bp are plotted in Figure 2A. As a control, a randomized TSS dataset was generated with the same total number and distribution (with respect to strand and being intragenic/intergenic) as the experimental dataset. The analysis was repeated with this dataset.
Analysis of published NET-seq data
Raw sequencing data files from NET-seq experiments (Larson et al., 2014) were obtained and mapped to the E. coli MG1655 genome using CLC Genomics Workbench. Sequence read depths at positions surrounding putative FliA promoters were calculated using a custom Python script. For FliA binding sites associated with a TSS, the NET-seq read coverage was calculated at every position from −100 to +100 relative to the TSS. For FliA binding sites not associated with a TSS, a TSS was predicted to be located 20 bp downstream of the motif center, and NET-seq read coverage was calculated from −100 to +100 relative to this position. For each region, NET-seq read coverage was normalized to local minimum and maximum values. Normalized read coverage was plotted as a heat map in Figure 3B.
FliA binding site conservation analysis across species
The locations of all E. coli FliA binding sites described previously (Fitzgerald et al., 2014) were used to identify homologous sequences in 24 other species (Table S1). A Position Specific Scoring Matrix (PSSM) was derived from the identified FliA binding sites in E. coli (Fitzgerald et al., 2014), as described previously (Bonocora et al., 2015). We then took a 300 bp sequence surrounding each FliA site in E. coli MG1655. For sites within ORFs we used BLASTX (Altschul et al., 1990) to search for homologous protein sequences in the selected bacterial species (BLAST E-value cut-off of 1e−04, low-complexity filter turned off). Using the PSSM, we scored the top-scoring BLAST hit for each species, searching within 100 bp of the position corresponding to the binding site in E. coli. For sites within intergenic regions, we used BLASTN to search for regions homologous to each of the 300 bp sequences in each of the selected species (BLAST E-value cut-off of 1e−04, low-complexity filter turned off), and extracted 100 bp on either side of the position corresponding to the position of the site in E. coli. If no hits were found, we took the sequence of the downstream gene in E. coli and used BLASTX to search for homologues in the selected species (BLAST E-value cut-off of 1e−04, low-complexity filter turned off). For each top BLAST hit, we used the position of the binding site in E. coli relative to the downstream gene to determine the predicted site of binding, and extracted 100 bp on either side. We calculated PSSM scores for all sequences in each of the selected regions. The best score for each region tested was selected for plotting in Figure 3A.
FliA binding site conservation in E. coli strains
All complete or partial genome sequences for E. coli (9432 genomes or contigs; Table S2) were downloaded directly from NCBI and individually scored for the presence FliA sites using the method described above for comparison to other species.
ChIP-seq of S. Typhimurium FliA
ChIP-seq was performed with strains DMF087 (FliA-FLAG3) or 14028s (untagged control) as previously described (Stringer et al., 2014). Sequence reads were mapped to the S. Typhimurium 14028s genome using CLC Genomics Workbench (Version 8). Peaks were called using a previously described analysis pipeline (Fitzgerald et al., 2014). Three peaks with a FAT score of 1 were identified in the control dataset; these peaks were all >30 kbp from any putative FliA binding site.
RNA-seq
RNA-seq was performed with strains 14028s and DMF088, as previously described (Stringer et al., 2014). Read mapping and differential expression analysis were performed using Rockhopper (McClure et al., 2013). The normalized expression values and indicators of statistical significance in Table 2 were generated using Rockhopper.
Analysis of FlhC sequence conservation
We used the RSAT “Comparative Genomics/Get Orthologs” tool (default parameters, except we required 50% amino acid sequence identity; (Medina-Rivera et al., 2015)) to identify 52 FlhC homologues from γ-proteobacterial species, each from a different genus. We aligned protein sequences using MUSCLE (v3.8, default parameters; (Edgar, 2004); Table S3), and for each FlhC homologue we counted matches at each amino acid position to the aligned E. coli FlhC sequence.
Identification of enriched sequence motifs in flhC-motA intergenic regions
We used the RSAT “Comparative Genomics/Get Orthologs” tool (default parameters, except we required 40% amino acid sequence identity; (Medina-Rivera et al., 2015)) to identify 130 FlhC homologues from proteobacterial species, each from a different genus. We aligned these protein sequences using MUSCLE (v3.8, default parameters; (Edgar, 2004); Table S4). To determine whether the flhC and motA genes are adjacent in each of the 131 species selected, we first used the RSAT “Comparative Genomics/Get Orthologs” tool (default parameters except required 40% amino acid sequence identity; (Medina-Rivera et al., 2015)) to extract 100 bp of sequence immediately downstream of the end of the intergenic region following flhC for each species. We then searched for open reading frames similar to that of E. coli K-12 motA using BLASTX (v2.2.3, hosted on EcoGene 3.0, default parameters, searching against the E. coli annotated proteome; (Altschul et al., 1997; Zhou and Rudd, 2013)). We discarded 32 FlhC sequences for which there was no BLASTX match to MotA with the corresponding sequence downstream of flhC. For each of the 98 remaining FlhC homologues, using the MUSCLE alignment described above (Table S4), we determined whether E. coli K-12 Asp178 is conserved.
We used the RSAT “Comparative Genomics/Get Orthologs” tool (Medina-Rivera et al., 2015) to extract intergenic sequence downstream of flhC for the 98 FlhC homologues from genomes where flhC and motA are adjacent genes. We discarded intergenic sequences <50 bp. We used MEME (v4.12.0, default settings, except we selected the “look on given strand only” option; (Bailey and Elkan, 1994)) to identify enriched sequence motifs in intergenic regions from species where FlhC Asp178 is conserved (n = 55) or is not conserved (n = 43), respectively.
Motility assays
Motility assays were performed as previously described (Fitzgerald et al., 2014).
Estimating the number of single base substitutions that would create a new FliA site in E. coli
We used the E. coli FliA PSSM (Fitzgerald et al., 2014) to calculate motif scores for all 27mer sequences in the E. coli MG1655 genome. For each score window between integer values (e.g. scores between 10 and 11, scores between 11 and 12, etc.), we determined the frequency of sequences that represent actual FliA binding sites, as determined previously by ChIP-seq (Fitzgerald et al., 2014). We then calculated motif scores for every 27mer in the genome with every possible single base substitution (i.e. 81 scores for each sequence). We binned scores in whole integer windows (e.g. a bin for scores between 10 and 11, a bin for scores between 11 and 12, etc.) and used the frequencies calculated for actual sites to estimate the number of mutated 27mers that would represent real FliA sites.
Supplementary Material
Intergenic sequences between flhC and motA for selected proteobacterial species where Asp178 of FlhC is conserved/not conserved. Putative FliA promoters identified by MEME for species where Asp178 of FlhC is not conserved are highlighted in yellow.
Acknowledgments
FUNDING INFORMATION
This work was funded by the National Institutes of Health through the NIH Director’s New Innovator Award Program, 1DP2OD007188 (JTW) and through grant 5R01GM114812 (JTW). This material is based on work supported by the National Science Foundation Graduate Research Fellowship under grant number DGE-1060277 (DMF). DMF was also supported by National Institutes of Health training grant T32AI055429. The funders had no role in study design, data collection and interpretation, or the decision to submit the work for publication.
We thank the Applied Genomic Technologies Core Facility for Sanger sequencing, the University at Buffalo Next Generation Sequencing Core Facility for Illumina sequencing, and the Wadsworth Center Media and Glassware Core facilities for media and glassware. We thank David Grainger, Keith Derbyshire, and members of the Wade group for helpful discussions. We thank the anonymous reviewers for their suggestions and comments on the manuscript.
Footnotes
ACCESSION NUMBERS
Raw ChIP-seq and RNA-seq data are available from the EBI ArrayExpress repository using accession numbers E-MTAB-6048 (RNA-seq) and E-MTAB-6049 (ChIP-seq).
References
- Altschul SF, Gish W, Miller W, Myers EW, Lipman DJ. Basic local alignment search tool. J Mol Biol. 1990;215:403–410. doi: 10.1016/S0022-2836(05)80360-2. [DOI] [PubMed] [Google Scholar]
- Altschul SF, Madden TL, Schaffer AA, Zhang J, Zhang Z, Miller W, Lipman DJ. Gapped BLAST and PSI-BLAST: a new generation of protein database search programs. Nucleic Acids Res. 1997;25:3389–3402. doi: 10.1093/nar/25.17.3389. [DOI] [PMC free article] [PubMed] [Google Scholar]
- Bailey TL, Elkan C. Fitting a mixture model by expectation maximization to discover motifs in biopolymers. Proc Int Conf Intell Syst Mol Biol. 1994;2:28–36. [PubMed] [Google Scholar]
- Beauregard A, Smith EA, Petrone BL, Singh N, Karch C, McDonough KA, Wade JT. Identification and characterization of small RNAs in Yersinia pestis. RNA Biol. 2013;10:397–405. doi: 10.4161/rna.23590. [DOI] [PMC free article] [PubMed] [Google Scholar]
- Bono AC, Hartman CE, Solaimanpour S, Tong H, Porwollik S, McClelland M, et al. Novel DNA Binding and Regulatory Activities for σ(54) (RpoN) in Salmonella enterica Serovar Typhimurium 14028s. J Bacteriol. 2017:199. doi: 10.1128/JB.00816-16. [DOI] [PMC free article] [PubMed] [Google Scholar]
- Bonocora RP, Fitzgerald DM, Stringer AM, Wade JT. Non-canonical protein-DNA interactions identified by ChIP are not artifacts. BMC Genomics. 2013;14:254. doi: 10.1186/1471-2164-14-254. [DOI] [PMC free article] [PubMed] [Google Scholar]
- Bonocora RP, Smith C, Lapierre P, Wade JT. Genome-Scale Mapping of Escherichia coli σ54 Reveals Widespread, Conserved Intragenic Binding. PLoS Genet. 2015;11:e1005552. doi: 10.1371/journal.pgen.1005552. [DOI] [PMC free article] [PubMed] [Google Scholar]
- Brewster RC, Weinert FM, Garcia HG, Song D, Rydenfelt M, Phillips R. The transcription factor titration effect dictates level of gene expression. Cell. 2014;156:1312–1323. doi: 10.1016/j.cell.2014.02.022. [DOI] [PMC free article] [PubMed] [Google Scholar]
- Chen YF, Helmann JD. Restoration of motility to an Escherichia coli fliA flagellar mutant by a Bacillus subtilis sigma factor. Proc Natl Acad Sci U S A. 1992;89:5123–5127. doi: 10.1073/pnas.89.11.5123. [DOI] [PMC free article] [PubMed] [Google Scholar]
- Churchman LS, Weissman JS. Nascent transcript sequencing visualizes transcription at nucleotide resolution. Nature. 2011;469:368–373. doi: 10.1038/nature09652. [DOI] [PMC free article] [PubMed] [Google Scholar]
- Edgar RC. MUSCLE: multiple sequence alignment with high accuracy and high throughput. Nucleic Acids Res. 2004;32:1792–1797. doi: 10.1093/nar/gkh340. [DOI] [PMC free article] [PubMed] [Google Scholar]
- Feklístov A, Sharon BD, Darst SA, Gross CA. Bacterial sigma factors: a historical, structural, and genomic perspective. Annu Rev Microbiol. 2014;68:357–376. doi: 10.1146/annurev-micro-092412-155737. [DOI] [PubMed] [Google Scholar]
- Fitzgerald DM, Bonocora RP, Wade JT. Comprehensive Mapping of the Escherichia coli Flagellar Regulatory Network. PLOS Genet. 2014;10:e1004649. doi: 10.1371/journal.pgen.1004649. [DOI] [PMC free article] [PubMed] [Google Scholar]
- Galagan J, Lyubetskaya A, Gomes A. ChIP-Seq and the Complexity of Bacterial Transcriptional Regulation. Curr Top Microbiol Immunol. 2013;363:43–68. doi: 10.1007/82_2012_257. [DOI] [PubMed] [Google Scholar]
- Galagan JE, Minch K, Peterson M, Lyubetskaya A, Azizi E, Sweet L, et al. The Mycobacterium tuberculosis regulatory network and hypoxia. Nature. 2013;499:178–83. doi: 10.1038/nature12337. [DOI] [PMC free article] [PubMed] [Google Scholar]
- Gordienko EN, Kazanov MD, Gelfand MS. Evolution of pan-genomes of Escherichia coli, Shigella spp., and Salmonella enterica. J Bacteriol. 2013;195:2786–2792. doi: 10.1128/JB.02285-12. [DOI] [PMC free article] [PubMed] [Google Scholar]
- Grainger DC. The unexpected complexity of bacterial genomes. Microbiol Read Engl. 2016;162:1167–1172. doi: 10.1099/mic.0.000309. [DOI] [PubMed] [Google Scholar]
- Guo MS, Updegrove TB, Gogol EB, Shabalina SA, Gross CA, Storz G. MicL, a new σE-dependent sRNA, combats envelope stress by repressing synthesis of Lpp, the major outer membrane lipoprotein. Genes Dev. 2014;28:1620–1634. doi: 10.1101/gad.243485.114. [DOI] [PMC free article] [PubMed] [Google Scholar]
- Guzman LM, Belin D, Carson MJ, Beckwith J. Tight regulation, modulation, and high-level expression by vectors containing the arabinose PBAD promoter. J Bacteriol. 1995;177:4121–4130. doi: 10.1128/jb.177.14.4121-4130.1995. [DOI] [PMC free article] [PubMed] [Google Scholar]
- Hartkoorn RC, Sala C, Uplekar S, Busso P, Rougemont J, Cole ST. Genome-wide definition of the SigF regulon in Mycobacterium tuberculosis. J Bacteriol. 2012;194:2001–2009. doi: 10.1128/JB.06692-11. [DOI] [PMC free article] [PubMed] [Google Scholar]
- Hollands K, Lee DJ, Lloyd GS, Busby SJW. Activation of sigma 28-dependent transcription in Escherichia coli by the cyclic AMP receptor protein requires an unusual promoter organization. Mol Microbiol. 2010;75:1098–1111. doi: 10.1111/j.1365-2958.2009.06913.x. [DOI] [PMC free article] [PubMed] [Google Scholar]
- Ide N, Ikebe T, Kutsukake K. Reevaluation of the promoter structure of the class 3 flagellar operons of Escherichia coli and Salmonella. Genes Genet Syst. 1999;74:113–116. doi: 10.1266/ggs.74.113. [DOI] [PubMed] [Google Scholar]
- Jarvik T, Smillie C, Groisman EA, Ochman H. Short-term signatures of evolutionary change in the Salmonella enterica serovar Typhimurium 14028 genome. J Bacteriol. 2010;192:560–567. doi: 10.1128/JB.01233-09. [DOI] [PMC free article] [PubMed] [Google Scholar]
- Koo BM, Rhodius VA, Campbell EA, Gross CA. Mutational analysis of Escherichia coli sigma28 and its target promoters reveals recognition of a composite −10 region, comprised of an “extended −10” motif and a core −10 element. Mol Microbiol. 2009;72:830–843. doi: 10.1111/j.1365-2958.2009.06691.x. [DOI] [PMC free article] [PubMed] [Google Scholar]
- Koo BM, Rhodius VA, Nonaka G, deHaseth PL, Gross CA. Reduced capacity of alternative sigmas to melt promoters ensures stringent promoter recognition. Genes Dev. 2009;23:2426–2436. doi: 10.1101/gad.1843709. [DOI] [PMC free article] [PubMed] [Google Scholar]
- Larson MH, Mooney RA, Peters JM, Windgassen T, Nayak D, Gross CA, et al. A pause sequence enriched at translation start sites drives transcription dynamics in vivo. Science. 2014;344:1042–1047. doi: 10.1126/science.1251871. [DOI] [PMC free article] [PubMed] [Google Scholar]
- Li J, Overall CC, Johnson RC, Jones MB, McDermott JE, Heffron F, et al. ChIP-Seq Analysis of the σE Regulon of Salmonella enterica Serovar Typhimurium Reveals New Genes Implicated in Heat Shock and Oxidative Stress Response. PLoS One. 2015;10:e0138466. doi: 10.1371/journal.pone.0138466. [DOI] [PMC free article] [PubMed] [Google Scholar]
- Liu X, Matsumura P. Differential regulation of multiple overlapping promoters in flagellar class II operons in Escherichia coli. Mol Microbiol. 1996;21:613–620. doi: 10.1111/j.1365-2958.1996.tb02569.x. [DOI] [PubMed] [Google Scholar]
- Lozada-Chávez I, Janga SC, Collado-Vides J. Bacterial regulatory networks are extremely flexible in evolution. Nucleic Acids Res. 2006;34:3434–3445. doi: 10.1093/nar/gkl423. [DOI] [PMC free article] [PubMed] [Google Scholar]
- Lybecker M, Bilusic I, Raghavan R. Pervasive transcription: detecting functional RNAs in bacteria. Transcription. 2014;5:e944039. doi: 10.4161/21541272.2014.944039. [DOI] [PMC free article] [PubMed] [Google Scholar]
- McClure R, Balasubramanian D, Sun Y, Bobrovskyy M, Sumby P, Genco CA, et al. Computational analysis of bacterial RNA-Seq data. Nucleic Acids Res. 2013;41:e140. doi: 10.1093/nar/gkt444. [DOI] [PMC free article] [PubMed] [Google Scholar]
- Medina-Rivera A, Defrance M, Sand O, Herrmann C, Castro-Mondragon JA, Delerce J, et al. RSAT 2015: Regulatory Sequence Analysis Tools. Nucleic Acids Res. 2015;43:W50–56. doi: 10.1093/nar/gkv362. [DOI] [PMC free article] [PubMed] [Google Scholar]
- Melamed S, Peer A, Faigenbaum-Romm R, Gatt YE, Reiss N, Bar A, et al. Global Mapping of Small RNA-Target Interactions in Bacteria. Mol Cell. 2016;63:884–897. doi: 10.1016/j.molcel.2016.07.026. [DOI] [PMC free article] [PubMed] [Google Scholar]
- Paget MS. Bacterial Sigma Factors and Anti-Sigma Factors: Structure, Function and Distribution. Biomolecules. 2015;5:1245–1265. doi: 10.3390/biom5031245. [DOI] [PMC free article] [PubMed] [Google Scholar]
- Park K, Choi S, Ko M, Park C. Novel sigmaF-dependent genes of Escherichia coli found using a specified promoter consensus. FEMS Microbiol Lett. 2001;202:243–250. doi: 10.1111/j.1574-6968.2001.tb10811.x. [DOI] [PubMed] [Google Scholar]
- Patenge N, Pappesch R, Khani A, Kreikemeyer B. Genome-wide analyses of small non-coding RNAs in streptococci. Front Genet. 2015;6:189. doi: 10.3389/fgene.2015.00189. [DOI] [PMC free article] [PubMed] [Google Scholar]
- Perez JC, Groisman EA. Evolution of transcriptional regulatory circuits in bacteria. Cell. 2009;138:233–244. doi: 10.1016/j.cell.2009.07.002. [DOI] [PMC free article] [PubMed] [Google Scholar]
- Peters JM, Mooney RA, Grass JA, Jessen ED, Tran F, Landick R. Rho and NusG suppress pervasive antisense transcription in Escherichia coli. Genes Dev. 2012;26:2621–2633. doi: 10.1101/gad.196741.112. [DOI] [PMC free article] [PubMed] [Google Scholar]
- Raghavan R, Sloan DB, Ochman H. Antisense Transcription Is Pervasive but Rarely Conserved in Enteric Bacteria. mBio. 2012;3:e00156–12. doi: 10.1128/mBio.00156-12. [DOI] [PMC free article] [PubMed] [Google Scholar]
- Reppas NB, Wade JT, Church G, Struhl K. The transition between transcriptional initiation and elongation in E. coli is highly variable and often rate-limiting. Mol Cell. 2006;24:747–757. doi: 10.1016/j.molcel.2006.10.030. [DOI] [PubMed] [Google Scholar]
- Shao W, Price MN, Deutschbauer AM, Romine MF, Arkin AP. Conservation of Transcription Start Sites within Genes across a Bacterial Genus. mBio. 2014;5:e01398–14. doi: 10.1128/mBio.01398-14. [DOI] [PMC free article] [PubMed] [Google Scholar]
- Sharma CM, Vogel J. Differential RNA-seq: the approach behind and the biological insight gained. Curr Opin Microbiol. 2014;19:97–105. doi: 10.1016/j.mib.2014.06.010. [DOI] [PubMed] [Google Scholar]
- Shimada T, Ishihama A, Busby SJ, Grainger DC. The Escherichia coli RutR transcription factor binds at targets within genes as well as intergenic regions. Nucleic Acids Res. 2008;36:3950–3955. doi: 10.1093/nar/gkn339. [DOI] [PMC free article] [PubMed] [Google Scholar]
- Singh SS, Singh N, Bonocora RP, Fitzgerald DM, Wade JT, Grainger DC. Widespread suppression of intragenic transcription initiation by H-NS. Genes Dev. 2014 doi: 10.1101/gad.234336.113. [DOI] [PMC free article] [PubMed] [Google Scholar]
- Stafford GP, Ogi T, Hughes C. Binding and transcriptional activation of non-flagellar genes by the Escherichia coli flagellar master regulator FlhD2C2. Microbiol Read Engl. 2005;151:1779–1788. doi: 10.1099/mic.0.27879-0. [DOI] [PMC free article] [PubMed] [Google Scholar]
- Stergachis AB, Haugen E, Shafer A, Fu W, Vernot B, Reynolds A, et al. Exonic transcription factor binding directs codon choice and affects protein evolution. Science. 2013;342:1367–1372. doi: 10.1126/science.1243490. [DOI] [PMC free article] [PubMed] [Google Scholar]
- Stringer AM, Currenti SA, Bonocora RP, Petrone BL, Palumbo MJ, Reilly AE, et al. Genome-Scale Analyses of Escherichia coli and Salmonella enterica AraC Reveal Non-Canonical Targets and an Expanded Core Regulon. J Bacteriol. 2014;196:660–671. doi: 10.1128/JB.01007-13. [DOI] [PMC free article] [PubMed] [Google Scholar]
- Stringer AM, Singh N, Yermakova A, Petrone BL, Amarasinghe JJ, Reyes-Diaz L, et al. FRUIT, a scar-free system for targeted chromosomal mutagenesis, epitope tagging, and promoter replacement in Escherichia coli and Salmonella enterica. PLoS One. 2012;7:e44841. doi: 10.1371/journal.pone.0044841. [DOI] [PMC free article] [PubMed] [Google Scholar]
- Thomason MK, Bischler T, Eisenbart SK, Förstner KU, Zhang A, Herbig A, et al. Global transcriptional start site mapping using differential RNA sequencing reveals novel antisense RNAs in Escherichia coli. J Bacteriol. 2015;197:18–28. doi: 10.1128/JB.02096-14. [DOI] [PMC free article] [PubMed] [Google Scholar]
- Toffano-Nioche C, Nguyen AN, Kuchly C, Ott A, Gautheret D, Bouloc P, Jacq A. Transcriptomic profiling of the oyster pathogen Vibrio splendidus opens a window on the evolutionary dynamics of the small RNA repertoire in the Vibrio genus. RNA N Y N. 2012;18:2201–2219. doi: 10.1261/rna.033324.112. [DOI] [PMC free article] [PubMed] [Google Scholar]
- Wade JT, Grainger DC. Pervasive transcription: illuminating the dark matter of bacterial transcriptomes. Nat Rev Microbiol. 2014;12:647–653. doi: 10.1038/nrmicro3316. [DOI] [PubMed] [Google Scholar]
- Wade JT, Reppas NB, Church GM, Struhl K. Genomic analysis of LexA binding reveals the permissive nature of the Escherichia coli genome and identifies unconventional target sites. Genes Dev. 2005:2619–2630. doi: 10.1101/gad.1355605. [DOI] [PMC free article] [PubMed] [Google Scholar]
- Wade JT, Roa DC, Grainger DC, Hurd D, Busby SJW, Struhl K, Nudler E. Extensive functional overlap between Sigma factors in Escherichia coli. Nat Struct Mol Biol. 2006;13:806–814. doi: 10.1038/nsmb1130. [DOI] [PubMed] [Google Scholar]
- Wang S, Fleming RT, Westbrook EM, Matsumura P, McKay DB. Structure of the Escherichia coli FlhDC complex, a prokaryotic heteromeric regulator of transcription. J Mol Biol. 2006;355:798–808. doi: 10.1016/j.jmb.2005.11.020. [DOI] [PubMed] [Google Scholar]
- Wunderlich Z, Mirny LA. Different gene regulation strategies revealed by analysis of binding motifs. Trends Genet TIG. 2009;25:434–440. doi: 10.1016/j.tig.2009.08.003. [DOI] [PMC free article] [PubMed] [Google Scholar]
- Xing K, He X. Reassessing the “duon” hypothesis of protein evolution. Mol Biol Evol. 2015;32:1056–1062. doi: 10.1093/molbev/msu409. [DOI] [PubMed] [Google Scholar]
- Yu HHY, Tan M. σ28 RNA polymerase regulates hctB, a late developmental gene in Chlamydia. Mol Microbiol. 2003;50:577–584. doi: 10.1046/j.1365-2958.2003.03708.x. [DOI] [PMC free article] [PubMed] [Google Scholar]
- Zhou J, Rudd KE. EcoGene 3.0. Nucleic Acids Res. 2013;41:D613–624. doi: 10.1093/nar/gks1235. [DOI] [PMC free article] [PubMed] [Google Scholar]
Associated Data
This section collects any data citations, data availability statements, or supplementary materials included in this article.
Supplementary Materials
Intergenic sequences between flhC and motA for selected proteobacterial species where Asp178 of FlhC is conserved/not conserved. Putative FliA promoters identified by MEME for species where Asp178 of FlhC is not conserved are highlighted in yellow.