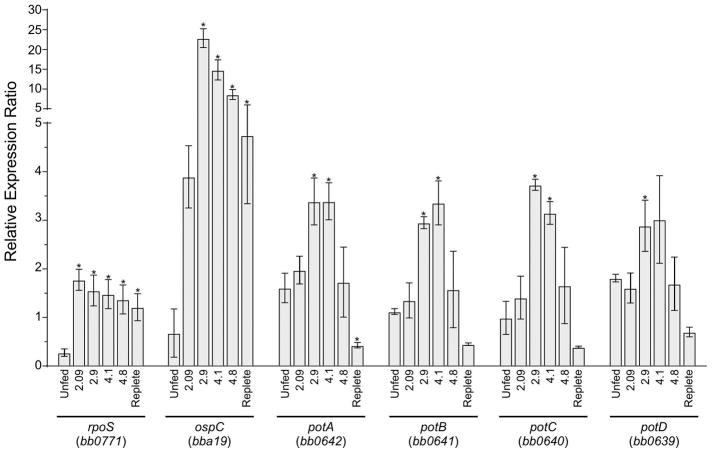
Fig. 3. Relative expression of potABCD operon genes during nymph feeding.
Graph of the expression of rpoS and ospC (as markers for the induction of the Rrp2-RpoN-RpoS pathway), and the four genes of the potABCD operon were analyzed by RT-qPCR. RNA was extracted from 3 pools of 5 ticks and cDNA was generated as described in the methods section. Scutal index was used to standardize feeding progress (Bontemps-Gallo et al., 2016, Falco et al., 1996). The scutal index is indicated under each bar. Relative gene expression was calculated using levels expression of enoS as reference. Data represent means ± standard deviation of three independent pools for each condition.

