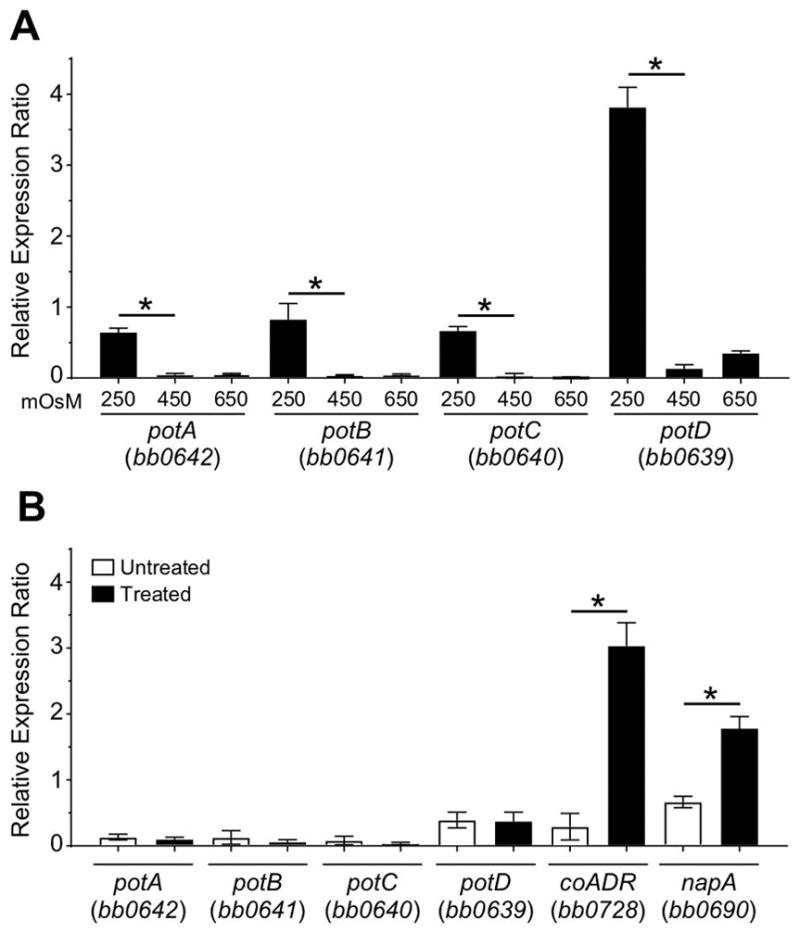
Fig. 4. Expression of potABCD operon under osmotic or oxidative stress.

(A) Graph of the expression analyses of the potABCD operon of B. burgdorferi grown in BSK-II at 250, 450 and 650 mOsM. (B) Graph of the expression analyses of the potABCD operon of B. burgdorferi grown in BSK-II after a treatment with 5 mM tert-butyl hydroperoxide compared to an untreated culture. The expression of coADR, napA (as marker of the induction of the oxidative stress response), and the four genes of potABCD operon were analyzed by RT-qPCR. Relative gene expression was calculated using levels expression of enoS as reference. Data represent means ± standard deviation of three independent experiments.
