
Figure 5.
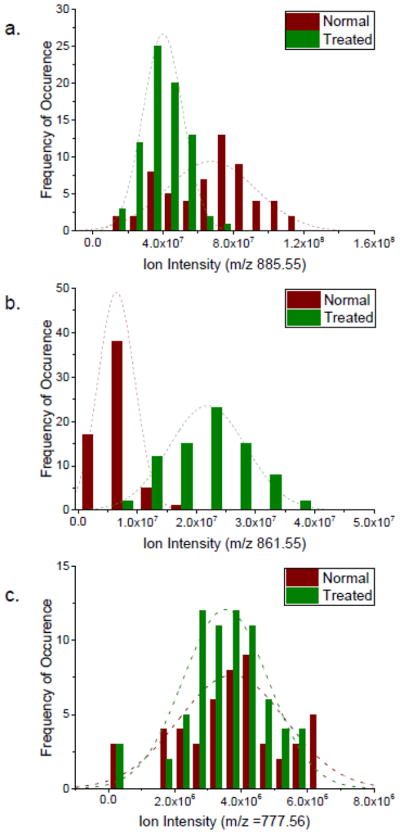
Histograms of ion abundances of m/z = 885.55 and 861.55, and 777.56 from normal (n=60) and LPS stimulated (n=70) RAW 264.7 cells. These results show that LPS stimulation selectively influences the expression of selected molecular species (b) m/z 885.55 and (c) m/z 861.55), shifting both the position of the mean and altering the shape of the distribution of ion abundance. The ion at m/z 777.56 shows no evidence of altered expression upon LPS stimulation.