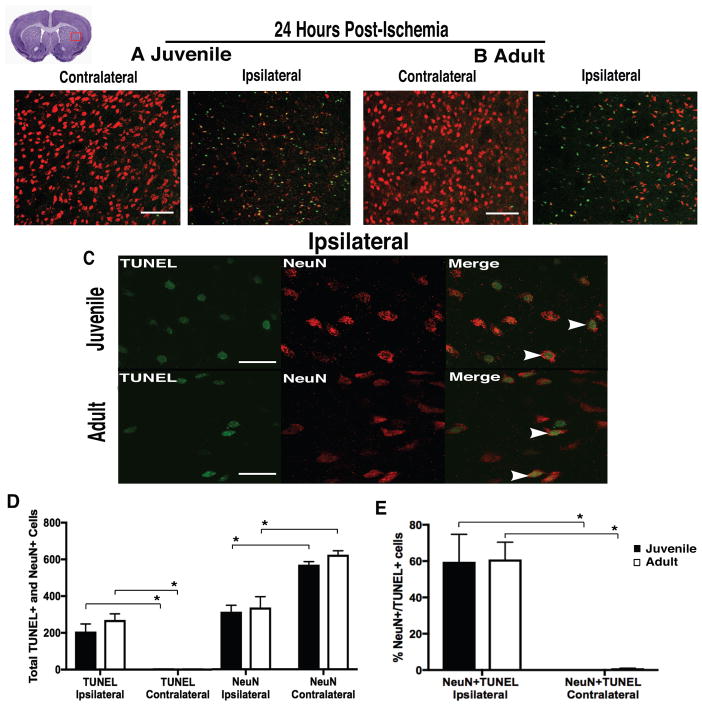
Figure 1. Equivalent injury following ischemic stroke.
(A–B) Representative images of FOV for analysis of TUNEL+ (green) and NeuN+ (red) cells, showing equivalent cell death and neuronal loss in the injured striatum of juvenile and adult mice at 24hr post-ischemia, compared to uninjured (contralateral) striatum. (C) Representative images at 100x magnification. (D) Comparable cell death (TUNEL+), neuron loss (NeuN+), and (E) neuronal cell death (NeuN+/TUNEL+) were found in the injured striatum of both groups. Data represent mean ± SEM, scale (A–B) = 100 μm, and scale (C) = 10 μm.

