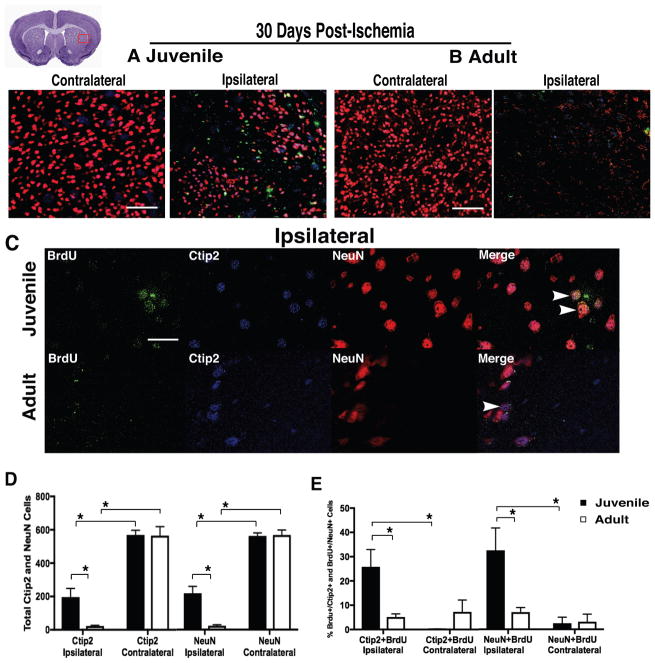
Figure 3. MSNs after ischemic stroke.
(A–B) Representative images of FOV for analysis of BrdU+ (green), Ctip2+ (blue), and NeuN+ (red), showing that newborn neurons differentiate into region-specific MSNs in juveniles, but not adults 30d post-ischemia. (C) Representative images of lateral striatum at 100x magnification. (D–E) Juvenile mice had more MSNs overall, and more newborn MSNs than adults. Data represent mean ± SEM, scale (A–B) = 100 μm, and scale (C) = 10 μm.

