
Fig.15.
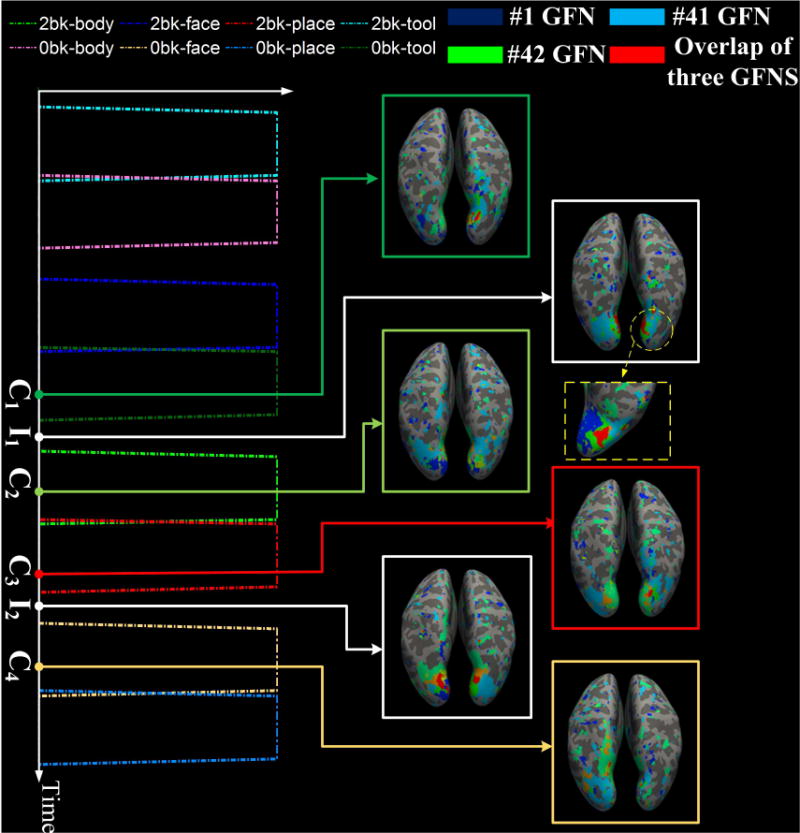
Dynamic spatial overlaps/interactions among three GFNs #1, #41 and #42. The spatial overlap among them is negatively correlated with the entire contrast design of the working memory task. The Pearson correlation coefficient is PCC = −0.43. At time points C1, C2, C3 and C4 within the contrast designs, the overlap area of three networks reduces to a minimal value, while at two idle time points I1 and I2, which lie between C1 and C2, as well as C3 and C4, respectively, the overlap area reaches a peak value.