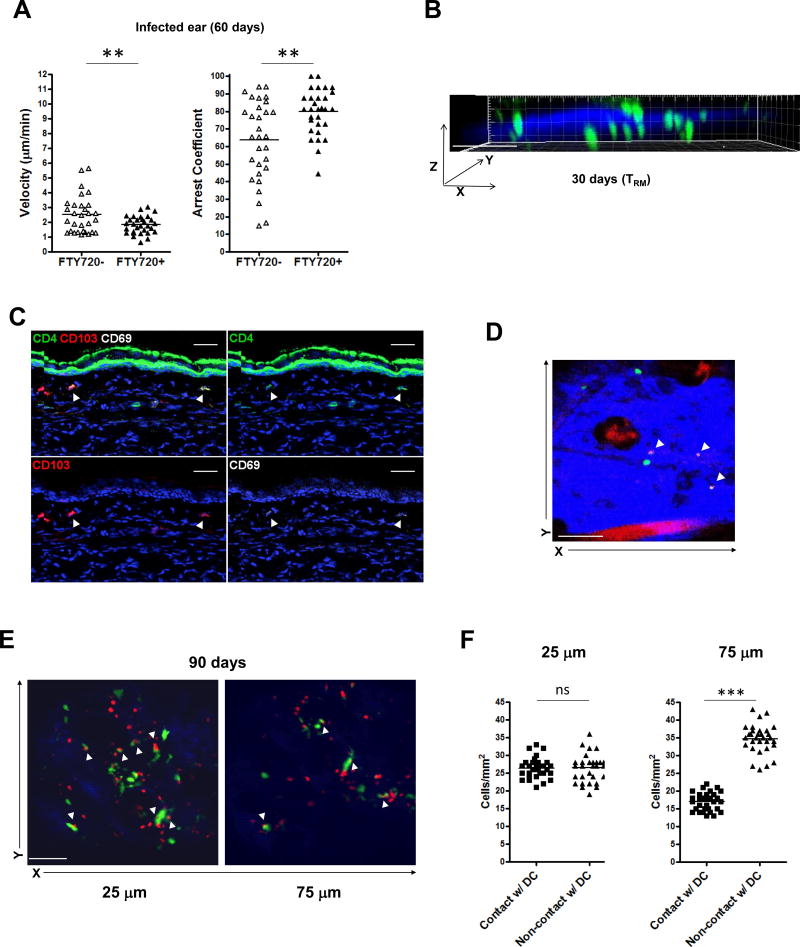
Figure 5. Distinct migratory properties of cutaneous CD4 TRM cells after C. albicans infection.
(A) Skin GFP+ CD4 T cell mean velocity (left) and arrest coefficients (right) in infected ear from FTY720-treated (one week of daily injection) and non-FTY720-treated mice at day 60 after candida infection. Points represent individual cells and the lines indicate the mean. Data are representative of three independent experiments. (B) GFP+ CD4 T cells (green) in candida-infected dermis, presented as y projection at day 30 after candida infection (dermis, blue). Scale bar, 100 µm. Data are representative of five independent experiments. (C) CD4+ T cells (green; arrows) expressed CD103 (red; arrows) and CD69 (white; arrows) in the upper dermal area of infected ear from RAG1−/− mice adoptively transferred with CD45.1+ CD4 T cells 30 days after candida infection. Scale bar, 30 µm. (D) GFP+ CD4 T cells (green) and CD69+GFP+ CD4 T cells (arrows, in vivo stained with Alexa647 anti-CD69 Ab) in candida-infected dermis at day 90 after candida infection. Imaging depth was 50 µm below the skin surface (dermis, blue). Scale bar, 100 µm. (E) CD11c-YFP+ DCs (green) and DsRed+ CD4 T cells (red) in candida-infected dermis at day 90 after candida infection. Imaging depths were 25 µm (left), 75 µm (right) below the skin surface (dermis, blue). Scale bar, 100 µm. Data are representative of three independent experiments (C–E). (F) The number of DsRed+ CD4 T cells in contact or not in contact with CD11c-YFP+ DCs in infected ear at day 90 after C. albicans infection. Points represent individual cells and the lines indicate the mean. ** p < 0.01, *** p < 0.001; ns, not significant.

