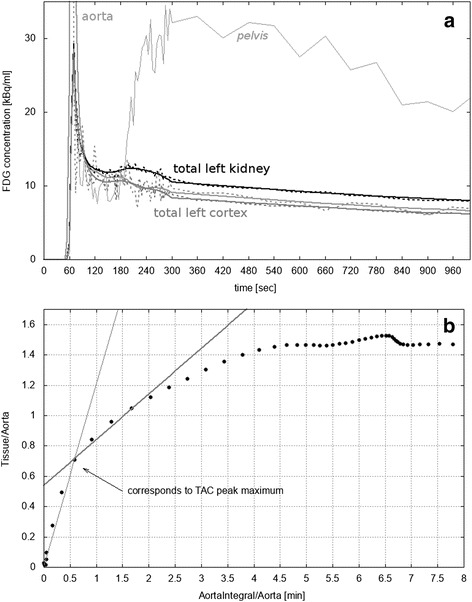
Fig. 3.

a Typical smoothed left cortex (gray), left total kidney (black), and aorta (light gray) time activity curves (TACs). For the sake of visibility, the aorta peak is outside of range (maximum 157.8 kBq/ml) and only the first 1000 s are plotted. Original curves are added as dotted lines. The TAC of the renal pelvis is indicated with thin gray lines. b Patlak plot of the left total kidney TAC. Two linear fits are shown: the first from the first point to that one which corresponds to the peak maximum (thin gray line) and the second covering the linear segment below 2 min starting at the point corresponding to the peak maximum (thick gray line, slope 0.3 min−1, offset 0.54). The latter was used to calculate the FDG glomerular filtration rate (GFRFDG)
