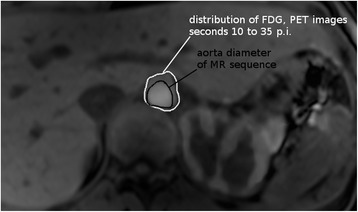
Fig. 4.

Fused image of MRI T1 sequence and PET. From the latter, the sum of the second to seventh frame (i.e., seconds 10 to 35) p.i. is shown. Due to partial volume effects, the FDG distribution in the PET images (white contour) clearly exceeds the aorta diameter observed with MRI image (black contour). Also, the initial accumulation of FDG in the cortex is visible
