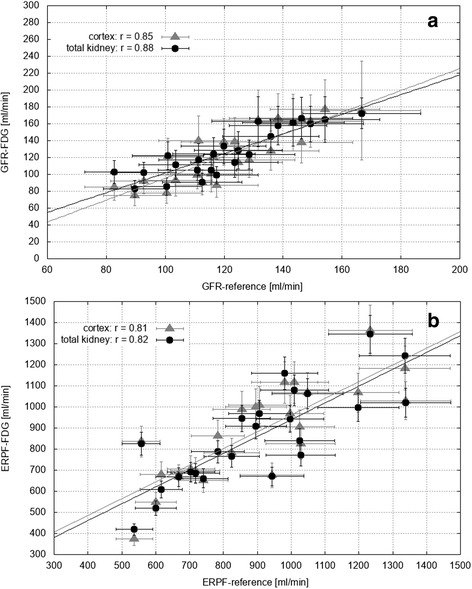
Fig. 5.

Reference values versus values obtained from total kidney (black) and cortex (gray) FDG TACs (time activity curves), for a GFR (glomerular filtration rate) and b ERPF (effective renal plasma flow). Lines of best fit are also shown. Error bars represent the calculated errors of each data point
