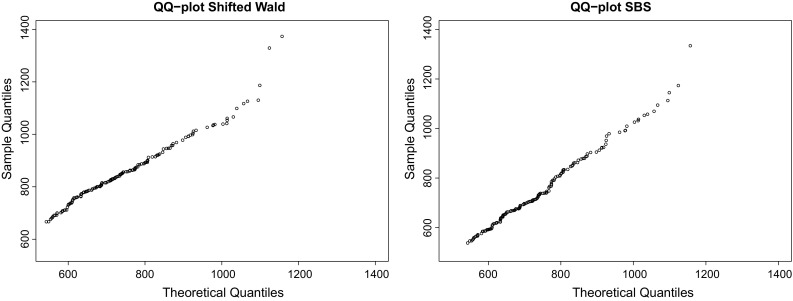
Fig. 3.

QQ plots of SW and SBS distributions for DS2 (from left to right), whose coefficients of determination were and , respectively. Again, this shows that the SBS can also be considered as a good candidate to fit RT data. For this case, the maximum likelihood estimators were and
