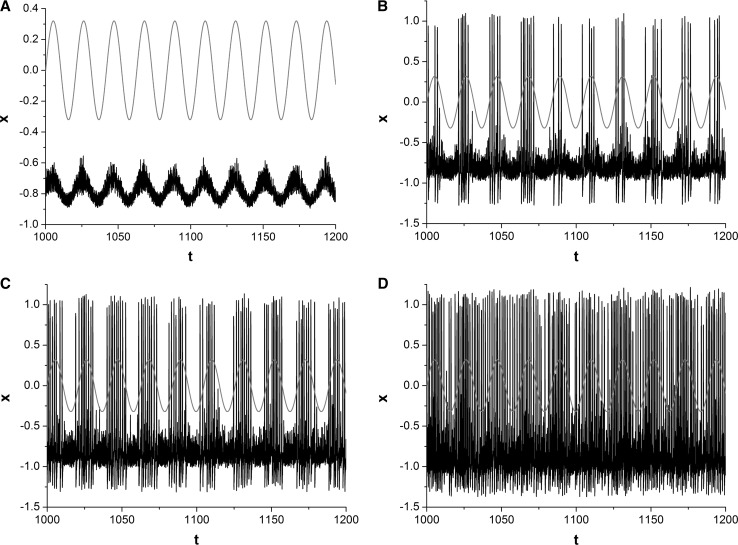
Fig. 2.
Sampled time series of variable x for different amplitudes. a A = 0.05; b A = 0.15; c A = 0.2; d A = 0.35. Correlation time τ is set as 0.05. The moderate amplitude A of SW noise makes synchronization between weak periodic signal (red line) and the output of system better. (Color figure online)

