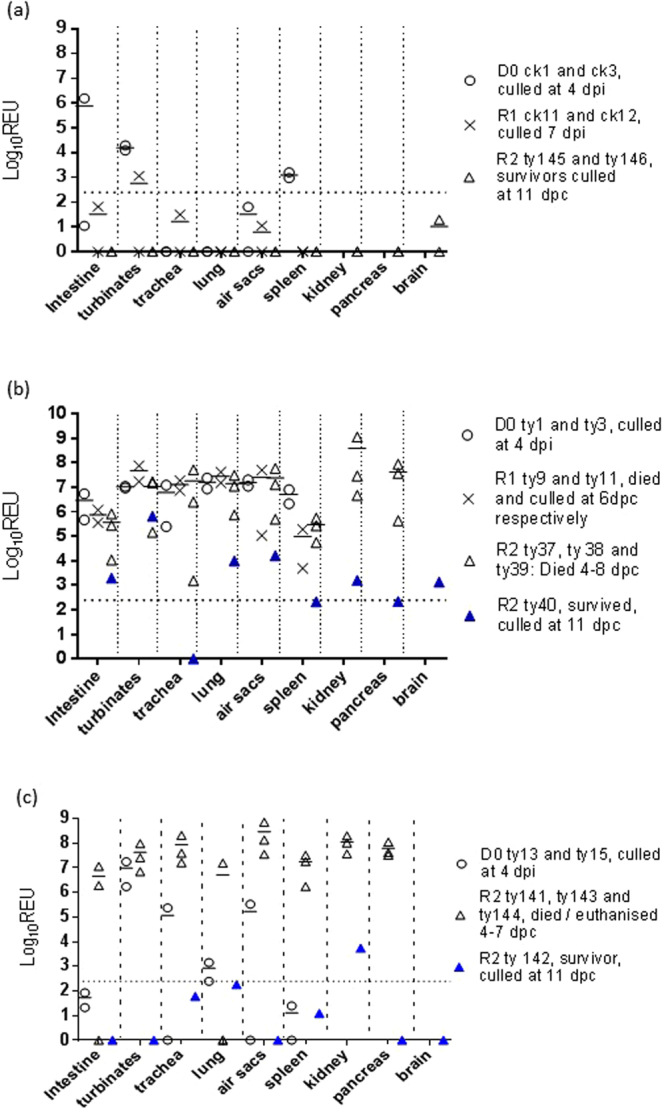
Figure 4.

H7N9 viral RNA loads in organs obtained from infected birds. Horizontal bars indicate mean viral RNA loads when >1 bird was sampled from a given group at a given time/time window. Broken horizontal is the cut-off threshold, as explained in Fig. 2. (a) Log10 REU values in organs of D0 and R1 chickens (ck) plus R2 turkeys (ty) (8log10EID50 direct infection of D0 chickens); (b) Log10 REU values in organs of D0, R1 and R2 turkeys (8log10EID50 direct infection of D0 turkeys); (c) Log10 REU values in organs of D0 and R2 turkeys (6log10EID50 direct infection of D0 turkeys). Pancreas and kidney specimens were first collected for RNA extraction only when mortality became apparent in R2 turkeys, with the brain specimens collected only at R2 cull (11 dpc).
