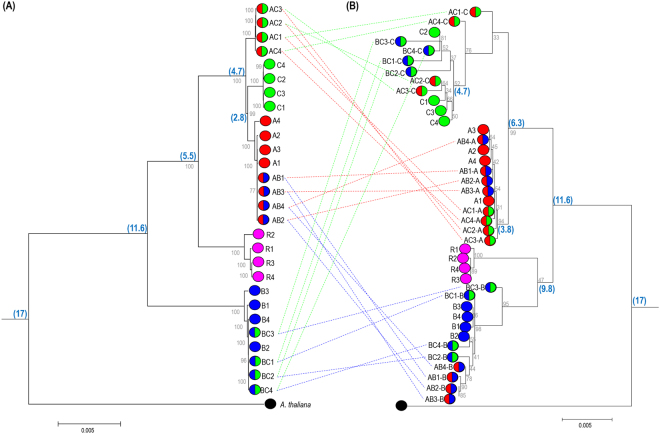
Figure 5.
Phylogenetic relationships of the genus Brassica inferred from complete chloroplast (A) and 45SnrDNA (B) sequences of 28 Brassica and Raphanus genotypes. Tree was developed using MEGA7 with 1,000 bootstrap replications. The bootstrap values for clades are shown in corresponding branches of the tree. Taxon markers with single and double circles represent diploid and tetraploid genomes, respectively. The circled legend for 45SnrDNA and chloroplast corresponds to each species. Dotted line connects the corresponding allotetradiploid genomes of chloroplast and 45SnrDNA. Species divergence times were inferred from Bayesian analysis, and are shown at the side of the node in million years (my). A. thaliana was used as an outgroup.

