Figure 1.
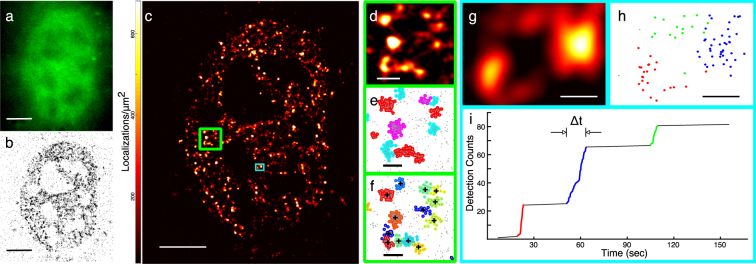
qSR facilitates analysis of the spatial organization and temporal dynamics of proteins in live cell super-resolution data. (a–c) Conventional fluorescence image, pointillist image, and super-resolution reconstruction image of RNA Polymerase II inside a living cell. (d,e) Spatial clustering of the data within the region highlighted in the large green box shown in (c) is performed using the DBSCAN algorithm embedded in qSR. (f) Spatial clustering of the same region is performed using the FastJet algorithm embedded in qSR. (g–i) Time-correlation super-resolution analysis (tcPALM) reveals temporal dynamics within a region of interest (ROI) shown in (g), and highlighted in the small cyan box in (c). In (i), for the selected ROI, a plot of the cumulative number of localizations as a function of time is represented. Localizations belonging to the three temporal clusters highlighted in (i) are plotted spatially in their corresponding (red, blue, green) colors in (h). Clusters of localizations which are grouped by time in (i) are also distinctly clustered in space. Scale Bars: (a–c) 5 µm; (d–f) 500 nm (g,h) 200 nm.

