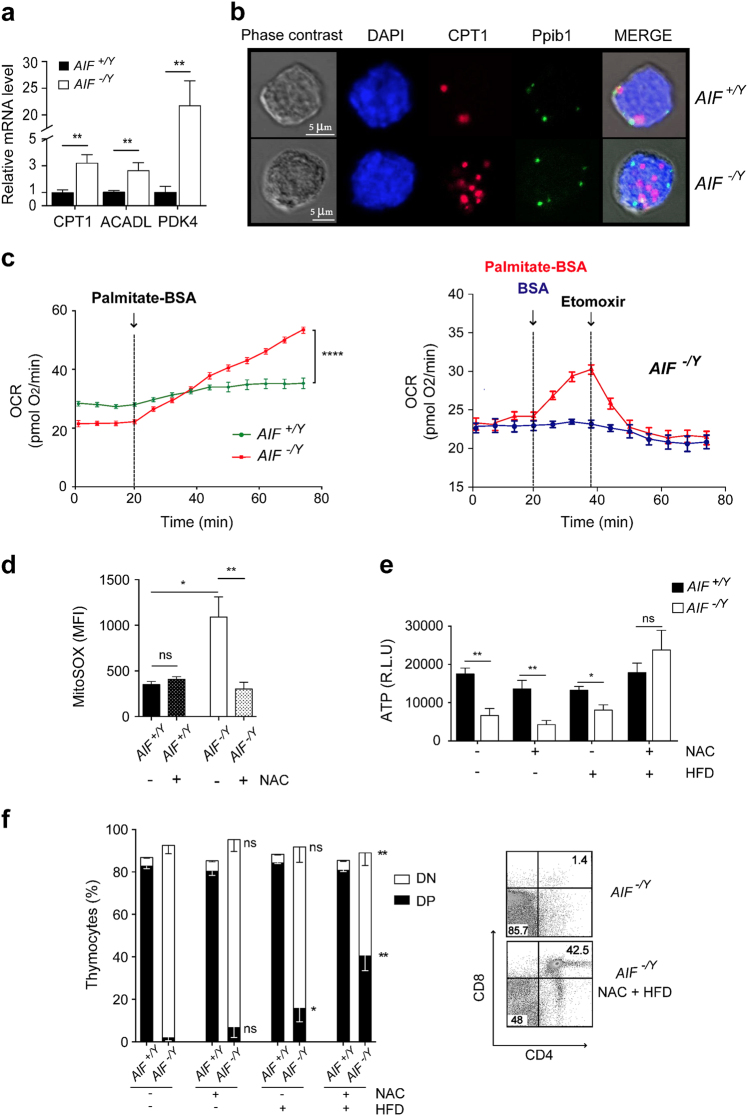
Fig. 7. Mitochondrial OXPHOS breakdown favored fatty acid metabolism reprogramming in thymocytes.
a CPT1, ACADL, and PDK4 mRNA levels determined by qPCR in AIF+/Y and AIF−/Y thymocytes from 21-day-old animals (n = 10 mice per group). The 18S mRNA expression was used to normalize the data. b RNAscope fluorescent detection of Cpt1α expression in representative AIF+/Y and AIF−/Y thymocytes from 21-day-old animals. Cpt1 mRNA transcripts were stained with a specific probe conjugated to Atto 550 (red) and nuclei were counterstained with DAPI (blue). Ppib expression, detected with a specific probe conjugated to Alexa 488 (green), was used as a control. Phase contrast analysis was used to visualize cells. Compared to the similar expression of Ppib in AIF+/Y and AIF−/Y thymocytes, CPT1 was overexpressed in AIF−/Y cells (n = 3 independent experiments with similar results). c Left, OCR was measured in thymocytes from AIF+/Y and AIF−/Y 21-day-old animals. After measurement of basal OCR, the FAO substrate Palmitate-BSA (17 µM) (Agilent Technologies) was injected and OCR was assessed during 60 min. Arrows indicate the time of Palmitate-BSA addition. Right, OCR was measured in thymocytes from AIF−/Y 21-day-old animals. After measurement of basal OCR, BSA control (blue line) or Palmitate-BSA FAO Substrate (17 µM) (red line) were injected followed by 200 µM Etomoxir addition to inhibit FAO. Arrows indicate the time of the injection of each reagent. OCR experiments were repeated three times with similar results. d Mitochondrial ROS levels measured in AIF+/Y and AIF−/Y thymocytes from 21-day-old newborns from dams supplied or not with NAC in drinking water (n = 9 animals per group). e Total ATP levels of AIF+/Y and AIF−/Y thymocytes from 21-day-old newborns from dams fed with standard control diet or high-fat diet (HFD) and supplied or not with NAC in drinking water (n = 9 animals per group). f Left, percentage of CD4−/CD8− (DN) and CD4+/CD8+ (DP) thymocytes in 21-day-old AIF+/Y and AIF−/Y newborns from dams fed as in e (n = 9 animals per group). The statistical analysis refers to the comparison between the percentage of DN or DP thymocytes recorded in the AIF−/Y newborns from dams fed in standard conditions and the percentage of DN or DP thymocytes recorded in AIF−/Y newborns from dams supplied either with NAC, HDF, or both. Right, representative flow cytometry panels of a CD4/CD8 labeling in AIF−/Y thymocytes from mice animals fed with a standard control diet (AIF−/Y) or with an HFD supplied with NAC (AIF−/Y NAC + HFD). Statistical significance was calculated by Mann–Whitney test. Bars represent mean ± SEM

