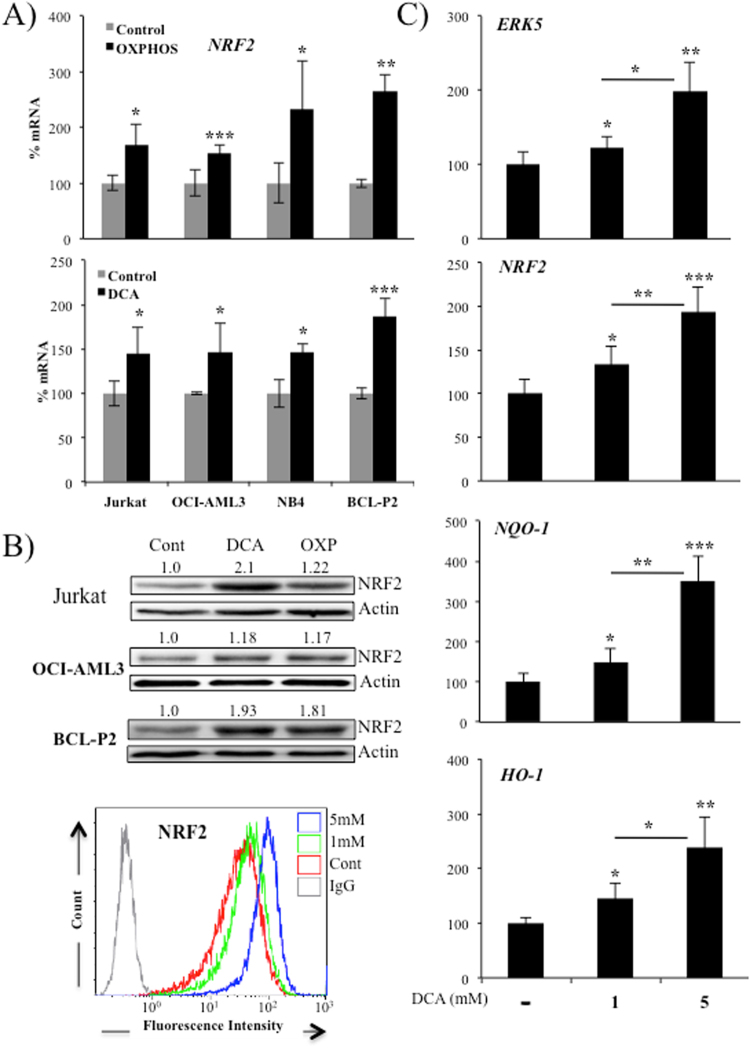
Figure 1.
Cells performing OXPHOS upregulated NRF2 expression. (A) Different hematopoietic cells were incubated in OXPHOS medium or treated with 5 mM DCA for 2 weeks. NRF2 mRNA was quantified by qPCR and values normalized to β-actin mRNA. Results were represented as the % of mRNA compared to cells growing only in glucose medium. Bars show average ± SD of 3 independent experiments performed in triplicate. (B) NRF2 protein expression was analyzed in several cell lines by western blotting (upper panel) or by flow cytometry in OCI-AML3 cells. (C) Hepatocytes from 4 donors were treated with the indicated concentration of DCA for 24 h and ERK5, NRF2, NQO-1 and HO-1 mRNA were analyzed. Bars show average ± SD of the four donors performed in duplicate.

