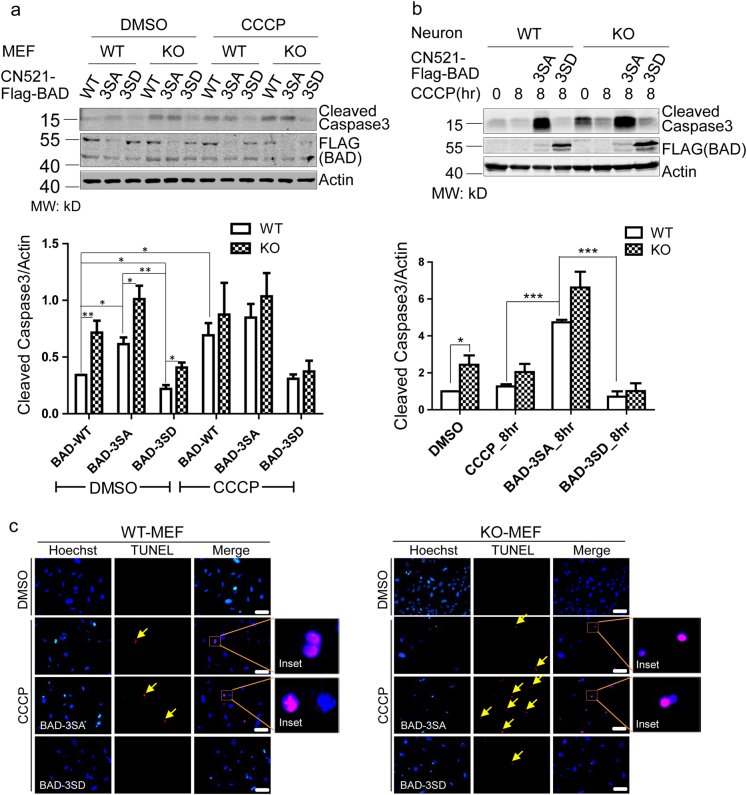
Fig. 7. PINK1-dependent BAD phosphorylation promotes survival of MEFs and neurons.
a Western blot analysis of caspase-3 cleavage after CCCP treatment for 24 h in cultured MEFs. WT and Pink1 KO cells, as well as these cells over-expressed with wild type, phosphorylation null and phosphorylation mimic mutant BAD were compared. Bar graph in the lower panel shows the expression levels of cleaved caspase-3 in each condition. b The same analysis as in a except that primary neurons were used. c TUNEL staining comparing WT and Pink1 KO MEF cells with or without CCCP treatment for 24 h, as well as comparing MEF cells overexpressed with wild type, phosphorylation null and phosphorylation mimic mutant BAD. Arrows indicate positive TUNEL signal. Scale bar, 50 μm.Data represent mean ± S.E.M. Student’s t-test: *p < 0.05, ** p< 0.01, *** p < 0.001

