Fig. 5.
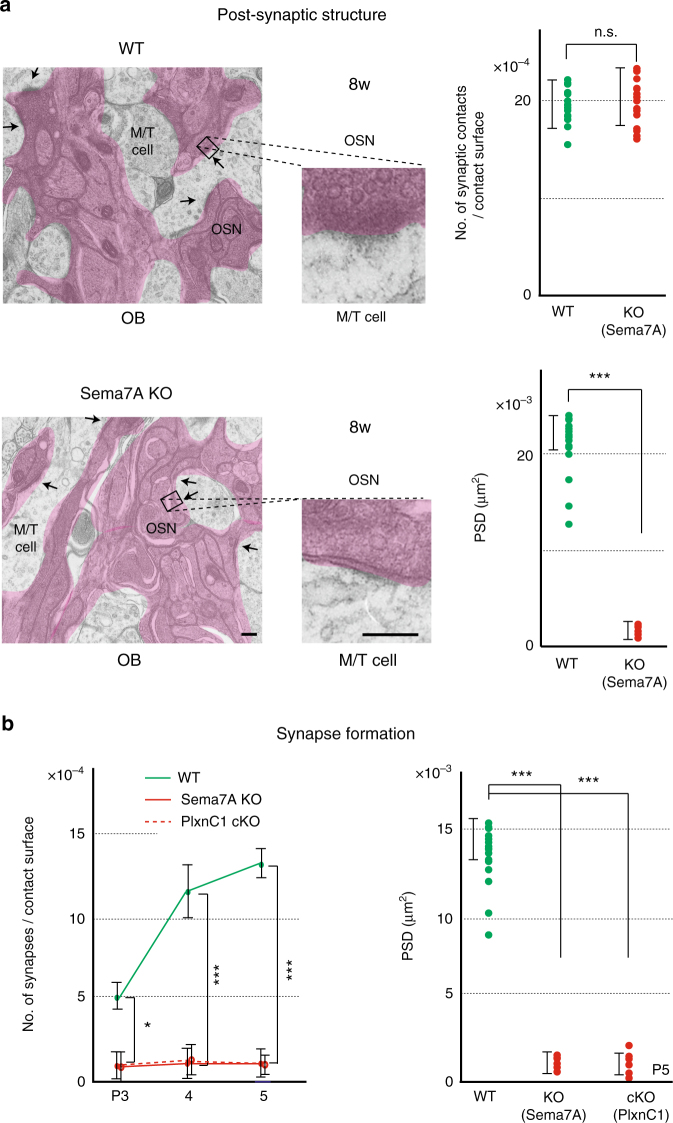
Synapse formation in the KOs of Sema7A/PlxnC1 signaling. a EM analysis of post-synaptic structures. Synaptic contacts and post-synaptic structures were analyzed in the 8w WT, and Sema7A total KO by electron microscopy (EM). Arrows indicate synaptic contacts. Enlarged views demonstrate that only the surface attachment, but not mature PSD, is formed in the KO. ***p < 0.005 (Student’s t-test). n.s., not significant. Error bars indicate SD (n = 3, 4 animals). Scale bars=300 nm. b The numbers of synaptic structures are compared among the WT, Sema7A total KO, and PlxnC1 cKO in neonatal stages by electron microscopy (left). *p < 0.05, ***p < 0.005 (Student’s t-test). Error bars indicate SD (n = 2, 2, 5 animals for each line). The areas of PSD at P5 are also compared (right). ***p < 0.005 (Student’s t-test). Error bars indicate SD (n = 6, 5, 6 animals)

