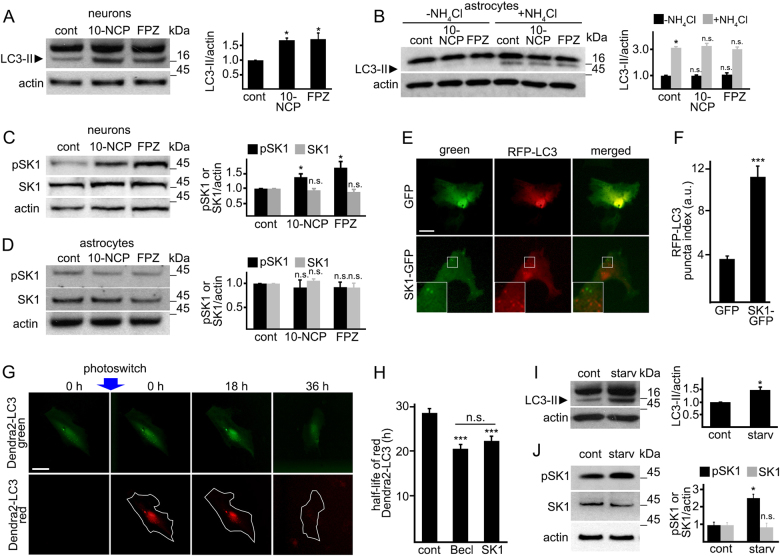
Fig. 1. SK1-associated autophagy differs between neurons and astrocytes.
a Cultured primary cortical neurons were treated with a vehicle (control, cont), or with 10-NCP (10-NCP, 5 µM), or fluphenazine (FPZ, 5 µM) for 4 h. Lysates were analyzed by western blotting with antibodies against LC3. Actin was used as a loading control. Bar graphs represent the quantification of the LC3-II intensities normalized to actin. *p (cont vs 10-NCP) = 0.042, *p (cont vs FPZ) = 0.024. b Cultured primary astrocytes were treated with a vehicle (control, cont), or with 10-NCP (10-NCP, 5 µM), or fluphenazine (FPZ, 5 µM), with or without NH4Cl for 4 h. Lysates were analyzed by western blotting with antibodies against LC3. Actin was used as a loading control. Bar graphs represent the quantification of the LC3-II intensities normalized to actin. p LC3 (cont vs 10-NCP) = 0.0749, p LC3 (cont vs FPZ) = 0.5297 (one-way ANOVA). ***p (cont vs cont + NH4Cl) = 0.0002 (t-student), p (cont + NH4Cl vs 10-NCP + NH4Cl) = 0.7699, p (cont + NH4Cl vs FPZ + NH4Cl) = 0.2257 (one-way ANOVA). Results were pooled from three independent experiments. c, d Cultured primary cortical neurons (c) and primary astrocytes (d) were treated with a vehicle (control, cont) or with 10-NCP (5 µM), or fluphenazine (FPZ, 5 µM) for 4 h. Lysates were analyzed by western blotting with antibodies against phosphorylated SK1 (pSK1) or pan-SK1 (SK1). Actin was used as a loading control. Bar graphs represent the quantification of the pSK1 and SK1 band intensities normalized to actin. In neurons: *p pSK1 (cont vs 10-NCP) = 0.0269, *p pSK1 (cont vs FPZ) = 0.0224; p SK1 (cont vs 10-NCP) = 0.7939, p SK1 (cont vs FPZ) = 0.208 (one-way ANOVA). In astrocytes: p pSK1 (cont vs 10-NCP) = 0.05356, p pSK1 (cont vs FPZ) = 0.9909; p SK1 (cont vs 10-NCP) = 0.1158, p SK1 (cont vs FPZ) = 0.4113 (one-way ANOVA). Results were pooled from three independent experiments. e Primary astrocytes were transfected with GFP and RFP-LC3 or with SK1-GFP and RFP-LC3. Twenty-four hours after transfection, astrocytes were imaged. Scale bar is 10 µm. A part of the image is zoomed in to visualize the SK1-GFP and RFP-LC3 puncta. f Quantification of the RFP-LC3 puncta index from e. ***p (GFP vs SK1-GFP) = 0.0001 (t test). One hundred and fifty cells were analyzed from three independent experiments. g The photoswitchable protein Dendra2 targeted to LC3 as a surrogate for the flux through autophagy. Brief irradiation with short-wave-length visible light causes Dendra2-LC3 to undergo an irreversible conformational change (“photoswitch”) and emit red fluorescence that can be tracked until altered Dendra2-LC3 is cleared. A cell is outlined to show cellular morphology. Scale bar is 10 µm. h Primary astrocytes were transfected with Dendra2-LC3 and an empty plasmid or with Dendra2-LC3 and a plasmid that encodes Beclin1, or Dendra2-LC3 and SK1. After the photoswitch, astrocytes were longitudinally imaged. The change in red fluorescence intensity over time was used to calculate the half-life of Dendra2-LC3. The single-cell half-life of Dendra2-LC3 was reduced by SK1 expression. Beclin1 was used as a positive control16. Fifty astrocytes were analyzed per condition from two independent experiments. ***p (control vs Becl) = 0.0001, ***p (control vs SK1) = 0.0001; p (Becl vs SK1) = 0.084 (one-way ANOVA). i, j Cultured primary astrocytes were maintained in DMEM supplemented with 10% fetal bovine serum (control, cont) or in Hanks’ balanced salt solution (starvation, starv) for 4 h. Samples were also treated with 10 mM NH4Cl to block the last step of autophagy-mediated degradation. Lysates were analyzed by western blotting with antibodies against LC3 (i) or with antibodies against phosphorylated SK1 (pSK1) or pan-SK1 (SK1) (j). Actin was used as a loading control. Bar graphs represent the quantification of the LC3-II, pSK1, or SK1 intensities normalized to actin. *p LC3 (control vs starv) = 0.017; p pSK1 (control vs starv) = 0.0072, p SK1 (control vs starv) = 0.331 (one-way ANOVA). Results were pooled from three independent experiments. n.s. not significant

