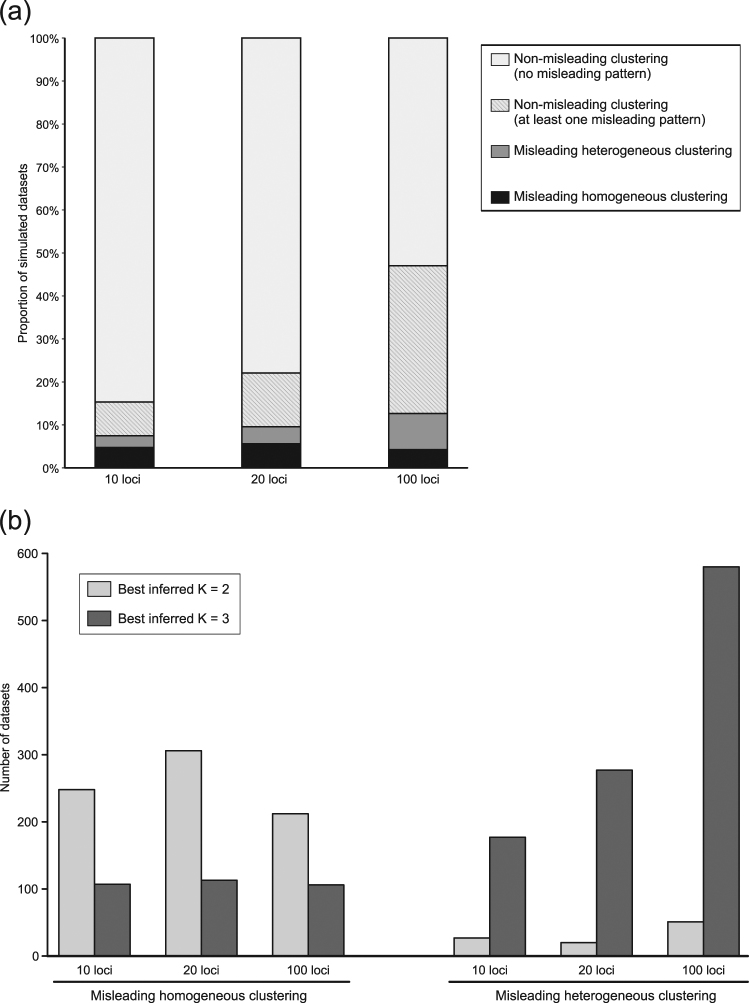
Fig. 4.
a Proportion of datasets with and without misleading patterns (Fig. 2b) for the ten STRUCTURE runs at K = 2. b Best inferred number of clusters K obtained by Evanno’s method for each number of loci within the datasets displaying misleading homogeneous (left) and misleading heterogeneous clusterings (right)

