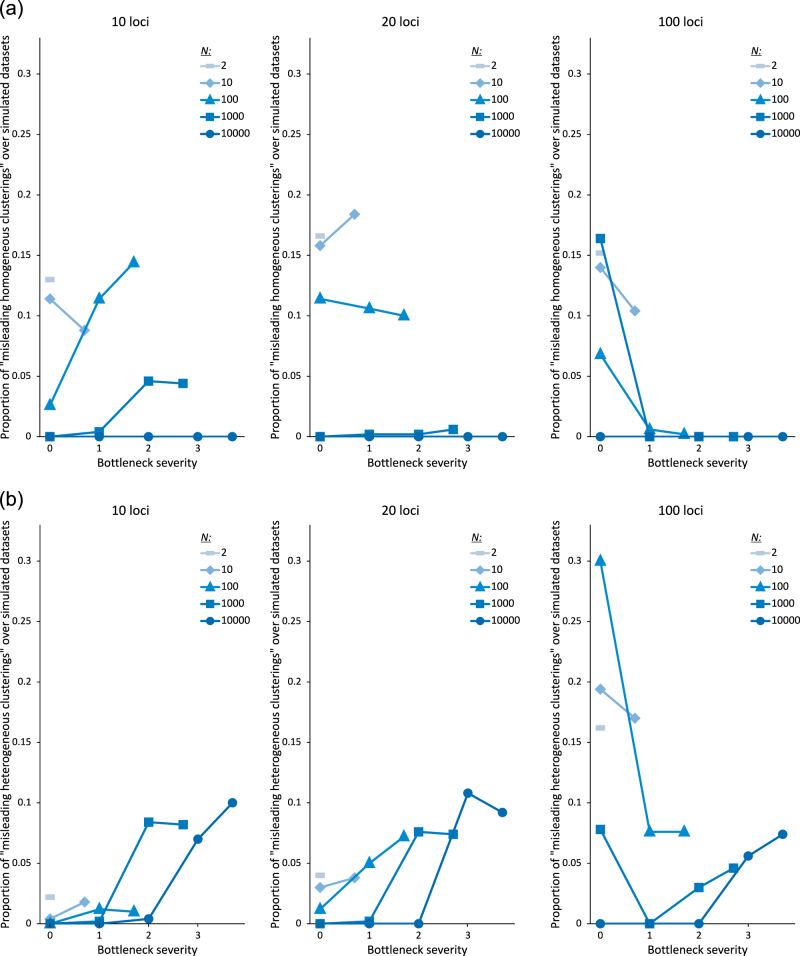
Fig. 5.
Proportion of simulated datasets yielding (a) misleading homogeneous clusterings and (b) misleading heterogeneous clusterings as a function of the parameters “effective population size at equilibrium” (N) and “bottleneck severity” (log10(N/NF)). Each proportion was calculated for 500 datasets

