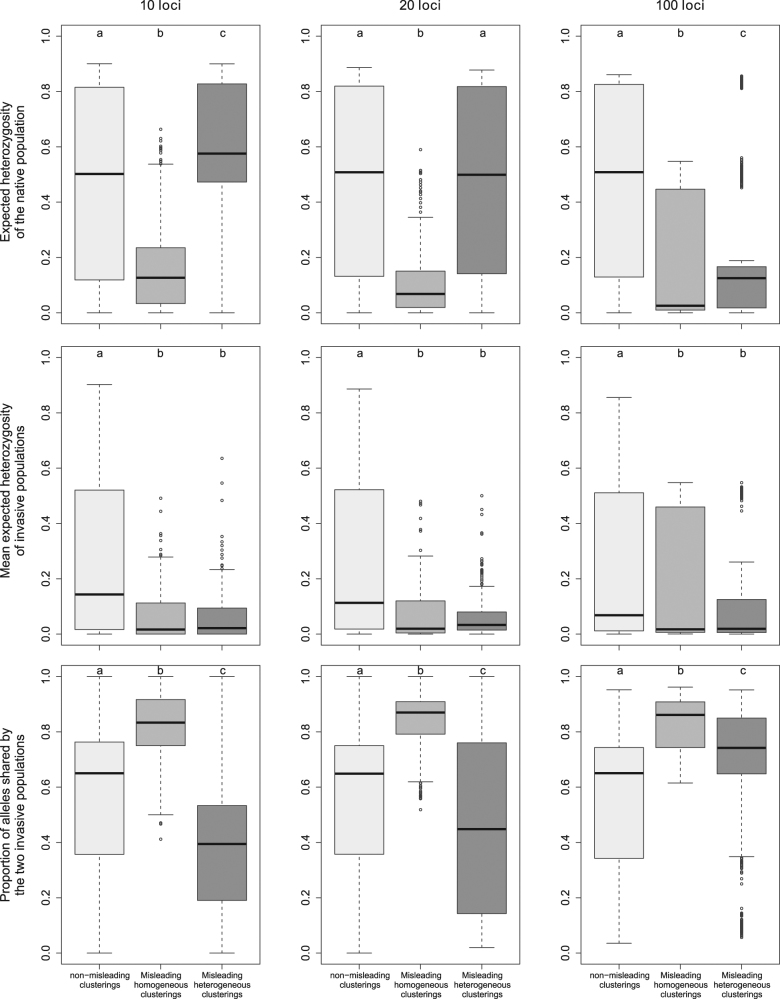
Fig. 6.
Tukey boxplots representing population genetics summary statistics for simulated datasets yielding non-misleading clusterings, misleading homogeneous clusterings or misleading heterogeneous clusterings. Within each frame, plots labeled with different letters are significantly different at the 5% level of significance (Mann–Whitney tests)

