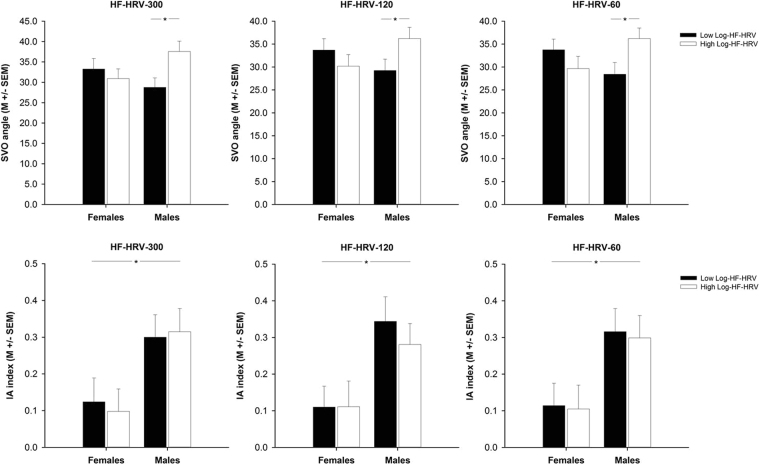
Figure 2.
Barplots demonstrating differences in social value orientation (SVO angle, IA index) between participants with high (white bars) and low (black bars) log-transformed high-frequency heart rate variability (Log-HF-HRV) that was derived from short-term (300 s) or ultra-short-term (120 s, 60 s) recordings of male and female participants’ heart rate. Bars represent mean values (M) and error bars represent standard error of mean values (SE M). *p ≤ 0.05.

