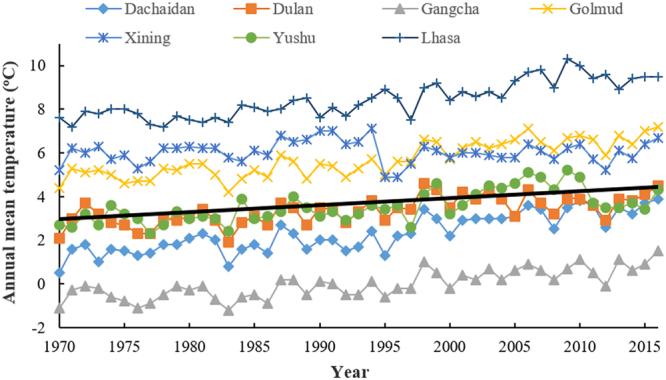
Figure 6.

Annual mean temperature of Dachaidan, Dulan, Gangcha, Golmud, Xining, Yushu and Lhasa from 1970–2016. The black solid line is the trend line of average values of annual mean temperature collected from the seven locations.

Annual mean temperature of Dachaidan, Dulan, Gangcha, Golmud, Xining, Yushu and Lhasa from 1970–2016. The black solid line is the trend line of average values of annual mean temperature collected from the seven locations.