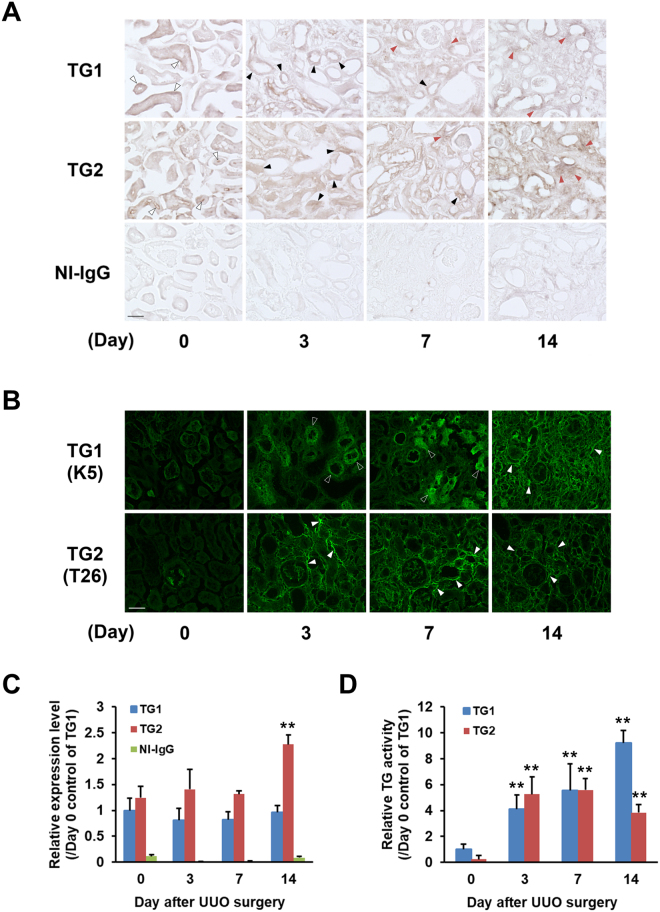
Figure 3.
Distributions of the expressions and activities of TG1 and TG2 in fibrotic kidneys. Each kidney section was subjected to the immunohistochemistry and in situ TG activity staining on the indicated days after UUO surgery. (A) Immunostaining was performed using polyclonal anti-mouse TG1 and TG2 antibodies, and rabbit NI-IgG as the negative control. Three kinds of arrowheads indicate the areas where staining is changing for TG1 and TG2 such as tubule basement membrane and lumen (white arrowheads), tubular epithelial cells (black arrowheads), and interstitial areas (red arrowheads). Bar = 50 μm. (B) The in situ activities of TG1 and TG2 were visualized using FITC-labeled substrate peptides (pepK5 and pepT26, respectively). The white frame and white arrowheads indicated the notable tubular epithelial cells and interstitial areas, respectively. Bar = 50 μm. The relative intensities from (A) and (B) were presented in (C) and (D), respectively. The data are presented as the mean ± SD (n = 4) (**P < 0.01, Student’s t-test).

