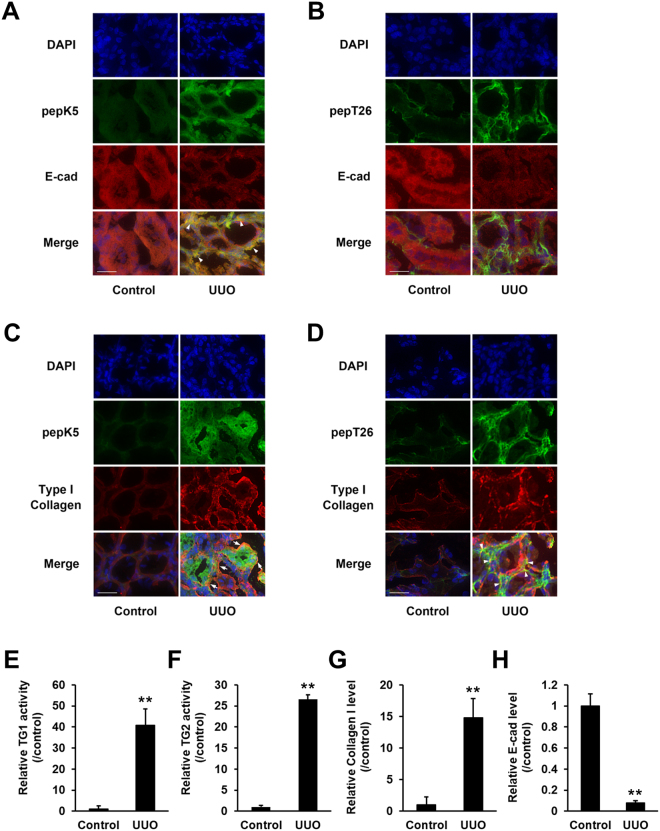
Figure 4.
Detailed distribution analysis of the enhanced activities of TG1 and TG2. The colocalization of the activity of each TG with the E-cadherin or type I collagen in the kidney sections was analyzed in the control and at 3 days after UUO surgery. (A,B) The kidney sections were incubated with FITC-labeled substrate peptides. Following fixation in 4% paraformaldehyde, the sections were immunostained using anti-E-cadherin antibody and counterstained with DAPI. Merged staining images are shown in the bottom lane, with arrowhead indicating the similar distributions between E-cadherin and each TG. Bars = 25 μm. (C,D) The kidney sections were incubated with FITC-labeled substrate peptides. Following fixation in 4% paraformaldehyde, the sections were immunostained using anti-collagen type 1A1 antibody and counterstained using DAPI. Merged staining images are shown in the bottom lane, with arrow indicating the different distributions between collagen and each TG. Bars = 25 μm. (E-H) The relative fluorescence intensities from (A–D) were presented. The data are presented as the mean ± SD (n = 6–8) (**P < 0.01, Student’s t-test).

