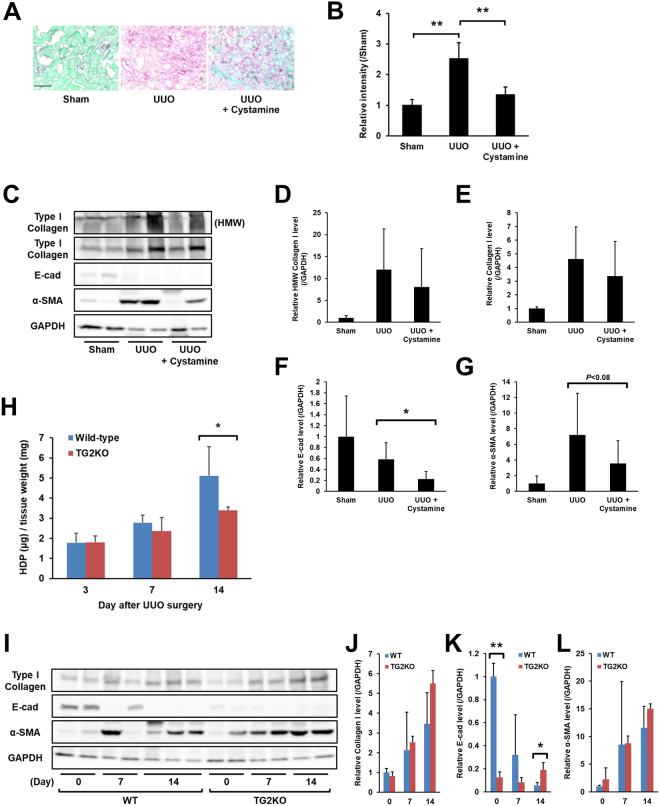
Figure 5.
The effect of TGs inhibitor or genetic defect of TG2 during renal fibrosis. Cystamine, a competitive inhibitor for the crosslinking activity of TGs, was orally administrated in drinking water (approximately 8.75 mg/kg/day) from 2 days before the UUO surgery (n = 9–12 mice per group). At 14 days after UUO, the fibrotic kidney was collected and evaluated for collagen deposition. (A) The kidney sections were stained using a Sirius Red Collagen Detection Kit. The red and green colors indicate the fibrillar collagen (type I to V collagen) and non-collagenous protein, respectively. Bar = 100 μm. (B) The relative intensity of contents was also evaluated in the same kidney tissues. The data are presented as the mean ± SD (n = 4) (**P < 0.01, Student’s t-test). (C) The protein levels in the whole lysate of kidney tissue from cystamine-administrated mice were analyzed by immunoblotting using each indicated antibody and GAPDH as a loading control for each sample. The bands of collagen I in the position of high molecular weight (HMW) were separately presented in this figure. The full-length gel is presented in Fig. S6. (D–G) Relative changes in the densitometric profiles of collagen I, E-cadherin, and α-SMA from (C) are presented under corresponding bands after normalizing to the changes in GAPDH. The data are presented as the mean ± SD (n = 6–7) (*P < 0.05, Student’s t-test). (H) The wild-type and TG2KO mice were sacrificed on days 3, 7, and 14 after UUO surgery (n = 6–8 mice per group). The HDP contents were evaluated in the kidney on each indicated day after UUO surgery. The data are presented as the mean ± SD (n = 3) (*P < 0.05, Student’s t-test). (I) The protein levels in the whole lysate of kidney tissue from the WT and TG2KO mice after UUO surgery were analyzed by immunoblotting using each indicated antibody and GAPDH as a loading control for each sample. The full-length gel is presented in Fig. S7. (J–L) Relative changes in the densitometric profiles from (D) are presented under corresponding bands after normalizing to the changes in GAPDH. The data are presented as the mean ± SD (n = 3–4) (**P < 0.01, *P < 0.05, Student’s t-test).

