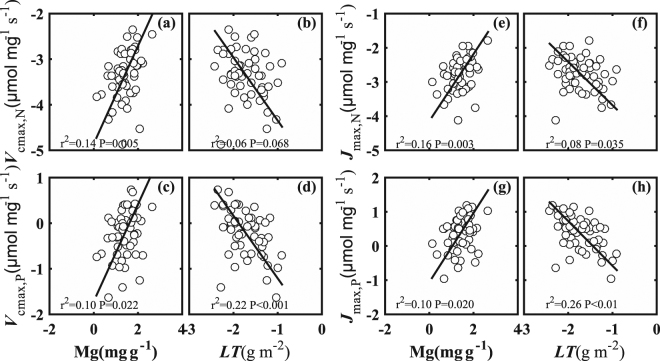
Figure 3.
Log-log plots of the ratio of maximum carboxylation rate (Vcmax) to leaf nitrogen (N) (Vcmax,N) in relation to (a) leaf magnesium (Mg) and (b) leaf thickness (LT). Log-log plots of the ratio of Vcmax to P (Vcmax,P) in relation to (c) Mg and (d) LMA. Log-log plots of the ratio of maximum electron transport rate (Jmax) to N (Jmax,N) in relation to (e) Mg and (f) LT. Log-log plots of the ratio of Jmax to P (Jmax,P) in relation to (g) Mg and (h) LT.

