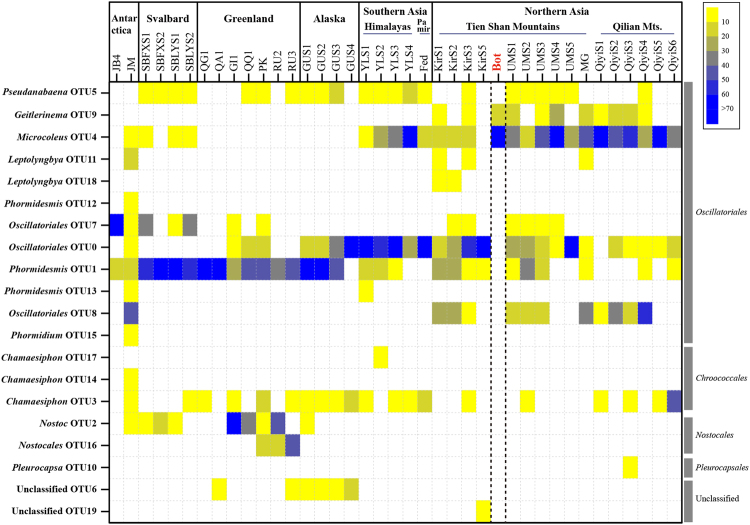
Fig. 2.
Geographic distribution of cyanobacteria from glacier surface (Segawa et al. 2017) and ice core samples of this study by 16S rRNA gene analysis. A representative heat map of clone percentage in the samples is shown. Blue and yellow indicate high and low expression, respectively. White indicates no detectable signal

