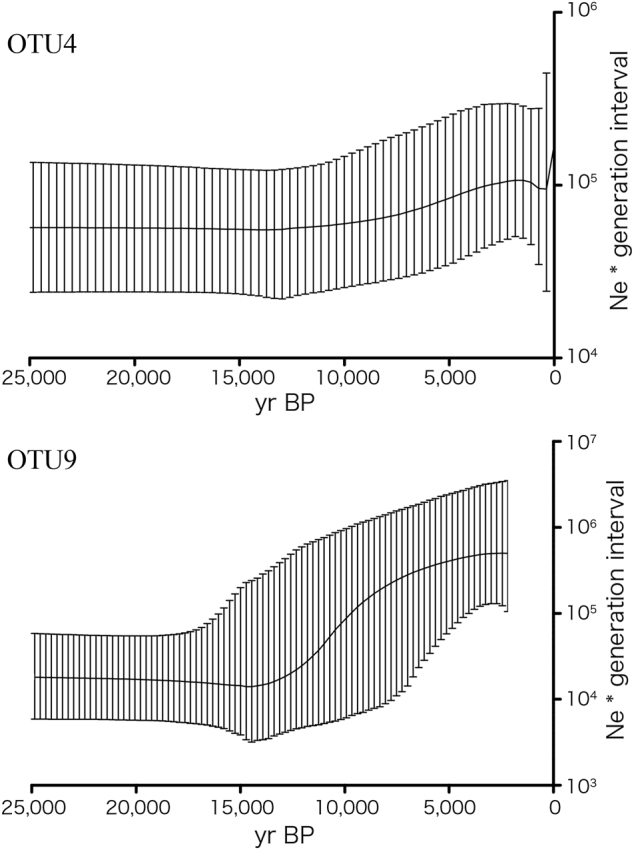
Fig. 5.

Bayesian skyline plots that show the Ne×t, where Ne stands for the effective population size and t stands for the generation intervals over time in cyanobacterial OTU4 and OTU9. Lines represent the median parameter estimates, with dashed lines representing the 95% highest posterior density interval. The x axis indicates years before present; the y axis indicates the effective population size multiplied by the generation interval (Ne×t)
