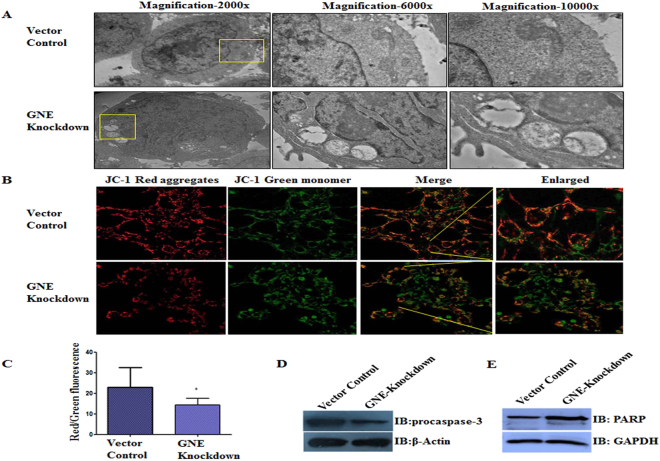
Figure 1.
Effect of GNE knockdown on mitochondrial dysfunction: (A) Morpho-structural analysis of mitochondria: representative TEM image showing alterations in mitochondrial morphology of GNE knockdown cells, compared to vector control cells. (B) Effect of GNE knockdown on dissipation of mitochondrial membrane potential (as measured by JC-1) using confocal microscopy, magnification 60×. Loss in mitochondrial membrane potential or depolarization is indicated by increased presence of JC-1 as monomeric form (green) and consequently leading to a decrease in the red/green fluorescence intensity ratio. (C) Histogram shows the ratio of red to green fluorescence intensity observed in GNE knockdown cell lines characterizing mitochondrial membrane potential. (D) Immunoblot analysis of cell lysates from indicated cell lines with anti-procaspase 3, β-actin was used as loading control. (E) Immunoblot analysis of cell lysates from indicated cell lines with anti-PARP antibody, GAPDH was used as loading control. The statistical significance was assessed by one-way ANOVA test. P values for * is <0.05.

