Figure 1.
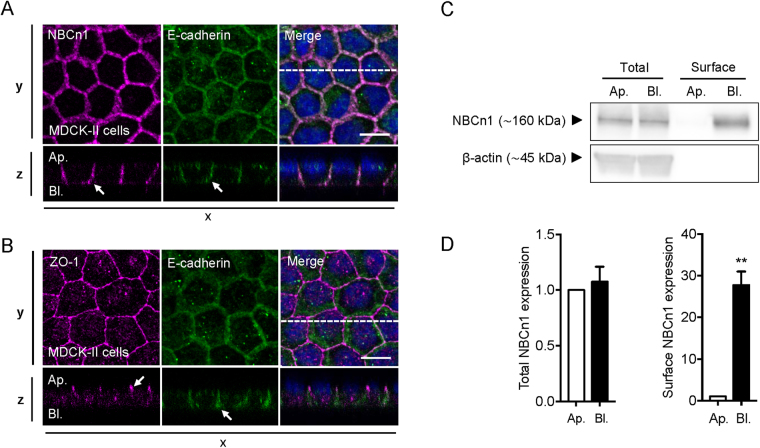
NBCn1 localizes to the basolateral membrane in polarized MDCK-II cells. MDCK-II cells were cultured on Transwell filters for 4 days to allow polarization (A–D). Cells were lysed and processed for immunofluorescence analysis (A,B) or cell surface biotinylation followed by Western blotting (C,D). (A,B) fluorescence images of NBCn1 (magenta), E-cadherin (green) and ZO-1 (magenta). Nuclei stained with DAPI (blue). Images were collected as z-stacks on a confocal microscope and shown as z-projections with corresponding xz-scans. Scale bar 10 µm. (C) Representative Western blots. ß-actin was used as a loading control. (D) Quantification of total NBCn1 expression and NBCn1 surface expression. Values are normalized to the apical pool of NBCn1. Quantifications of Western blot data are shown as means with SEM error bars. ** indicate P < 0.01. Student’s t test. Data are representative of 3 independent experiments. Ap.: apical; Bl.: basolateral.

