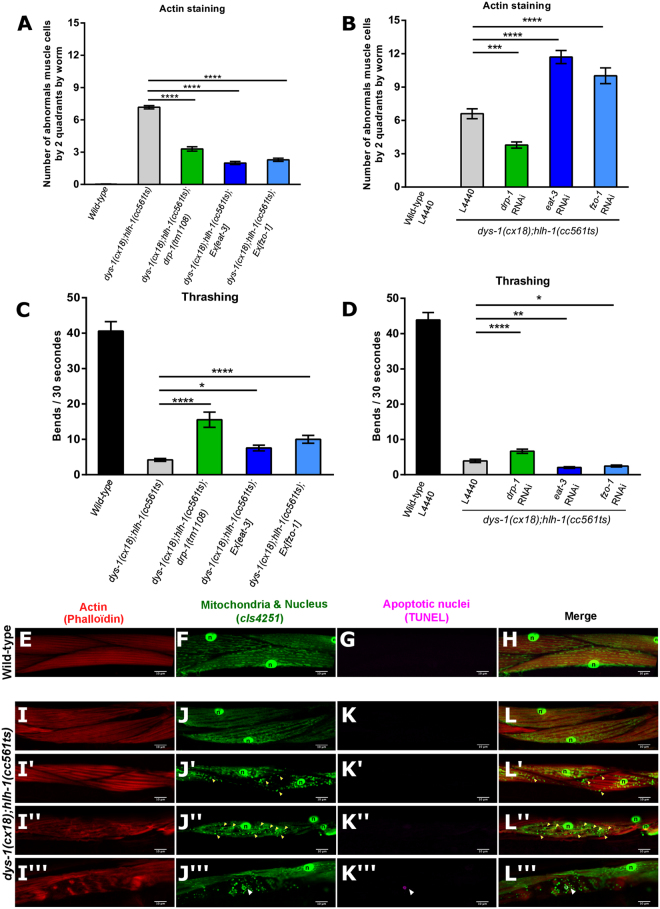
Figure 2.
DRP-1 induces dystrophin-dependent muscle degeneration and locomotion defects. (A) Number of abnormal C. elegans body wall muscle cells by two quadrants quantified by phalloïdin staining in wild-type worms, dys-1(cx18);hlh-1(cc561ts) mutant worms, or dys-1(cx18);hlh-1(cc561ts) mutant worms with drp-1(tm1108) mutation or overexpression of eat-3 or fzo-1 (n = 70 worms at least). (B) Number of abnormal C. elegans body wall muscle cells by two quadrants quantified by phalloïdin staining in dys-1(cx18);hlh-1(cc561ts) mutant worms fed either with the empty vector L4440 or with RNAi constructs targeting drp-1 or eat-3 or fzo-1 (n = 60 worms at least). (C) Quantification of worm trashing in wild-type worms, dys-1(cx18);hlh-1(cc561ts) mutant worms or dys-1(cx18);hlh-1(cc561ts) mutant worms with drp-1(tm1108) mutation or overexpression of eat-3 or fzo-1 (n = 25 worms at least). (D) Quantification of worm trashing in dys-1(cx18);hlh-1(cc561ts) mutant worms fed with the empty vector L4440 or with drp-1 RNAi or eat-3 RNAi or fzo-1 RNAi (n = 100 worms at least). All the experiments were performed on L4 + 3 day-old worms. One-way ANOVA, Tukey’s multiple comparisons test. Data represent the mean obtained by pooling at least three independent assays. Errors bars represent SEM *p < 0.05 **p < 0.01 ***p < 0.001 ****p < 0.0001 ns. indicates that the mean is not statistically significantly different from the mean obtained in the control condition. Representative confocal images of muscles in wild-type worms of: (E) actin network by phalloïdin staining; (F) mitochondrial network and nuclei (n) organization visualized with the ccIs4251 transgene in C. elegans body wall muscle cells; (G) apoptotic nuclei visualized by TUNEL staining and (H) the merge of the phalloidin, mitochondrial and TUNEL staining. (I- L”’) Representative confocal images of body wall muscle cells of dys-1(cx18);hlh-1(cc561ts) mutant worms presenting different degrees of muscle degeneration. (I-I”’) actin network by phalloïdin staining; (J-J”’) mitochondrial network visualized with the ccIs4251 transgene in C. elegans body wall muscle cells; (K-K”’) apoptotic nuclei visualized by TUNEL staining; (L-L”’) merge of the phalloidin, mitochondrial and TUNEL staining. All the experiments were performed in L4 + 3 day-old worms. Yellow arrows indicate circular mitochondria. White arrow indicates apoptotic nuclei. Scale bar 10 μm. n indicates nuclei. (x630).

