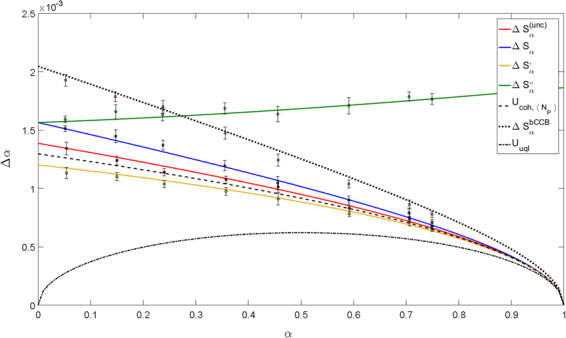
Figure 4.

Uncertainty on α in function of the mean value of α. Four different estimators are considered. Solid lines are the theoretical curves, dashed and dotted lines are the limits corresponding to the best quantum and classical cases when the same mean energy of the probe and the same detection efficiency are considered. The markers are the experimental data. In this configuration the measured efficiencies are ηP = 0.76 and ηR = 0.43 < 0.5, while . In this condition while ΔS′α remains below the classical benchmark.
