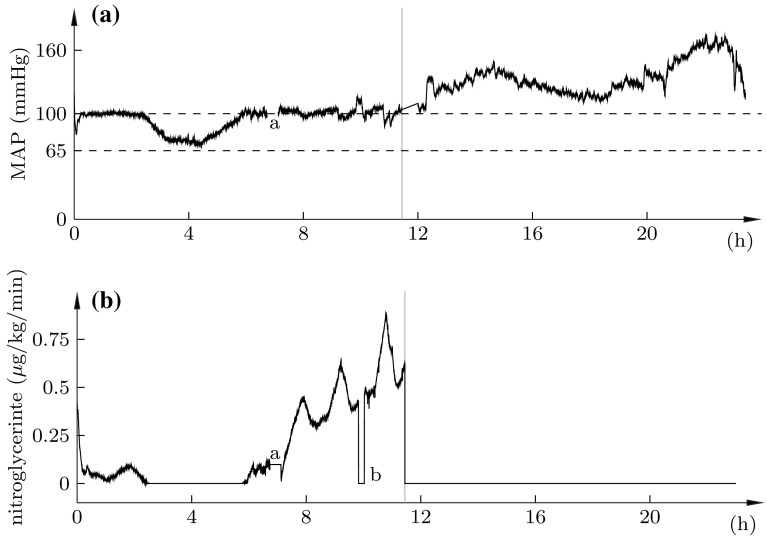
Fig. 6.
Nitroglycerine infusion (bottom) and resulting MAP (top, black). Vertical grey line shows division between closed-loop control (left), and halted nitroglycerine infusion (right). Dashed lines indicate limits of the desired MAP range [5]. Marks show: a missing data due replacement of arterial pressure transducer; b infusion pause due to syringe replacement

