Figure 4.
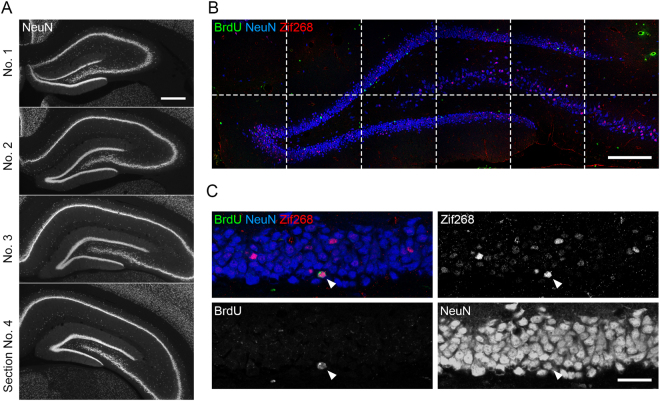
Immunofluorescence detection of BrdU-, NeuN-, and Zif268-positive cells. (A) Representative epifluorescence images from four sections used for the analyses. The sections were immunostained for NeuN. One in every 12 of the 40-µm-thick sections was selected, and the selected sections were designated #1–4. Scale bar: 500 µm. (B) An example of confocal image tiles, consisting of 12 images (512 × 512 pixels each) covering the whole granule cell layer. Blue: NeuN, red: Zif268, green: BrdU. Scale bar: 200 µm. (C) A confocal image showing BrdU/NeuN/Zif268-triple-positive cells (arrowheads). Scale bar: 30 µm.

